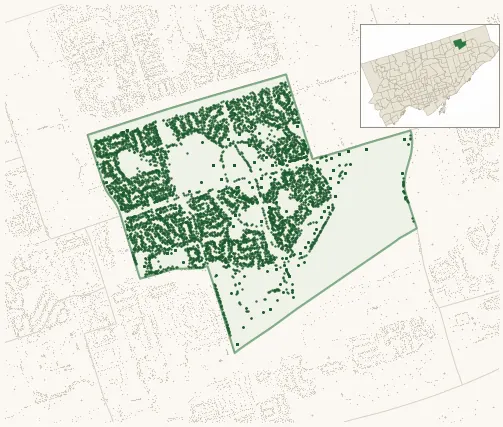
Neighbourhood · #129
Agincourt North
7,424 street trees · 1.89 km² · pop. 27,540
What the numbers say
Agincourt North is middle-of-the-pack for street trees (110th of 158), with 7,424 city-owned street trees across 1.89 km² — 3,934 per km².
Tree canopy covers 17.4% of the neighbourhood (119th of 158) — essentially unchanged since 2008. (This includes all trees — street, park, and private — from the 2018 land-cover raster.)
Across 149 distinct species (Shannon diversity 3.81, 139th of 158), the most common is acer platanoides at 13.9% of the trees.
Most common species here
| Species | Trees | Share |
|---|---|---|
| Norway Maple acer platanoides | 1,031 | 13.9% |
| Littleleaf Linden tilia cordata | 520 | 7.0% |
| Honey Locust Shademaster gleditsia triacanthos f. inermis 'shademaster' | 506 | 6.8% |
| Norway Schwedler Maple acer platanoides 'schwedleri' | 301 | 4.1% |
| Sargents Apple malus sargentii | 286 | 3.9% |
The biggest tree on record
A Willow (salix) at 295 CHARTLAND BLVD S — 159 cm DBH, the largest of the 7,424 street trees here. · Street View
Explore
Tree counts and species from the City of Toronto Street Tree dataset (city-owned trees in the road allowance only — not parks or private property). Canopy % and heat proxy derive from the 2018 land-cover raster. Population is from the 2021 census, joined by the 158-neighbourhood model.