Stories from Toronto's street-tree data
Writing and visualizations based on the City of Toronto's inventory of 689,013 street trees.
A printable 5×5 tree-bingo game in three difficulty tiers — easy (any-block species), medium (neighbourhood walk), hard (rare-tree treasure hunt). Suitable for kids, dog walks, and slow Saturday transit commutes.
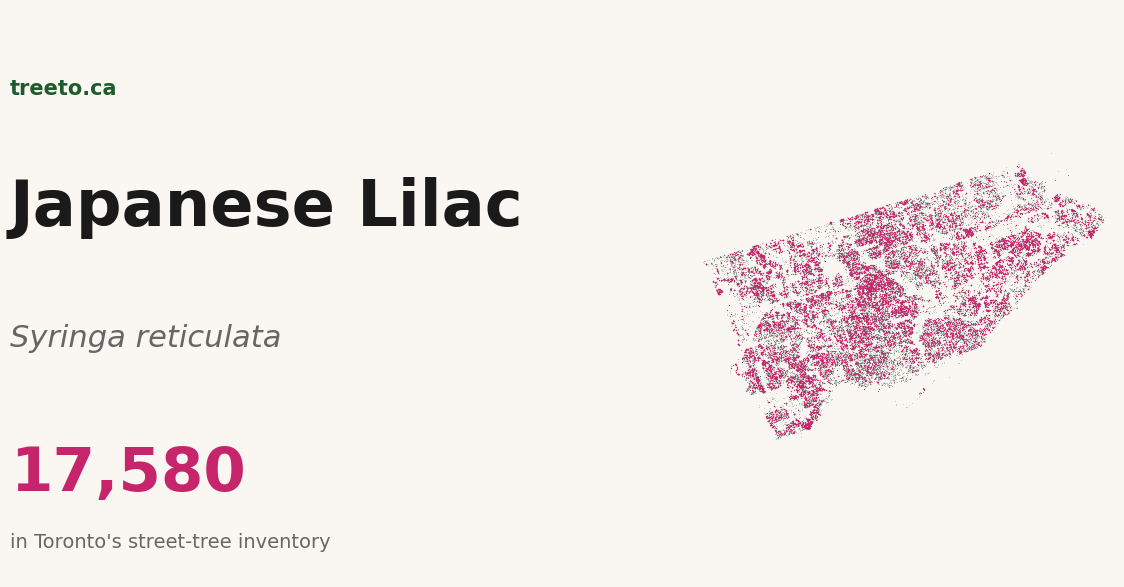
Lilacs are the most reliably memory-tied flower in North American family folklore. The species your grandmother had in her yard was almost certainly Syringa vulgaris — and the Canadian-bred Preston hybrids that came after it. Plus when to visit the Royal Botanical Gardens.
Toronto's most tree-dense residential 100-metre cell is on Arlington Ave in Humewood-Cedarvale. 128 catalogued street trees in a single block. 34 of them red oaks. A walking tour of one block, and what it tells us about the city's quiet ecological turnaround.
Doug Tallamy's research applied to Toronto's planting palette. Oaks support 534 species of native insects. Ginkgos support 3. Honey locusts: 46. Norway maples: ~5. The ecological gap that doesn't show on a canopy map.
Yasuyuki Aono has 1,200 years of cherry-blossom dates in Kyoto — assembled from court diaries, temple ledgers, and hanami records. Toronto has 689,013 trees catalogued once. Same idea, opposite axis.
A 250-cm hawthorn that physically can't exist. 4,664 cherries the city can't tell apart. A single pawpaw on Macdonell Avenue. Three small mysteries from a 689,013-row dataset.
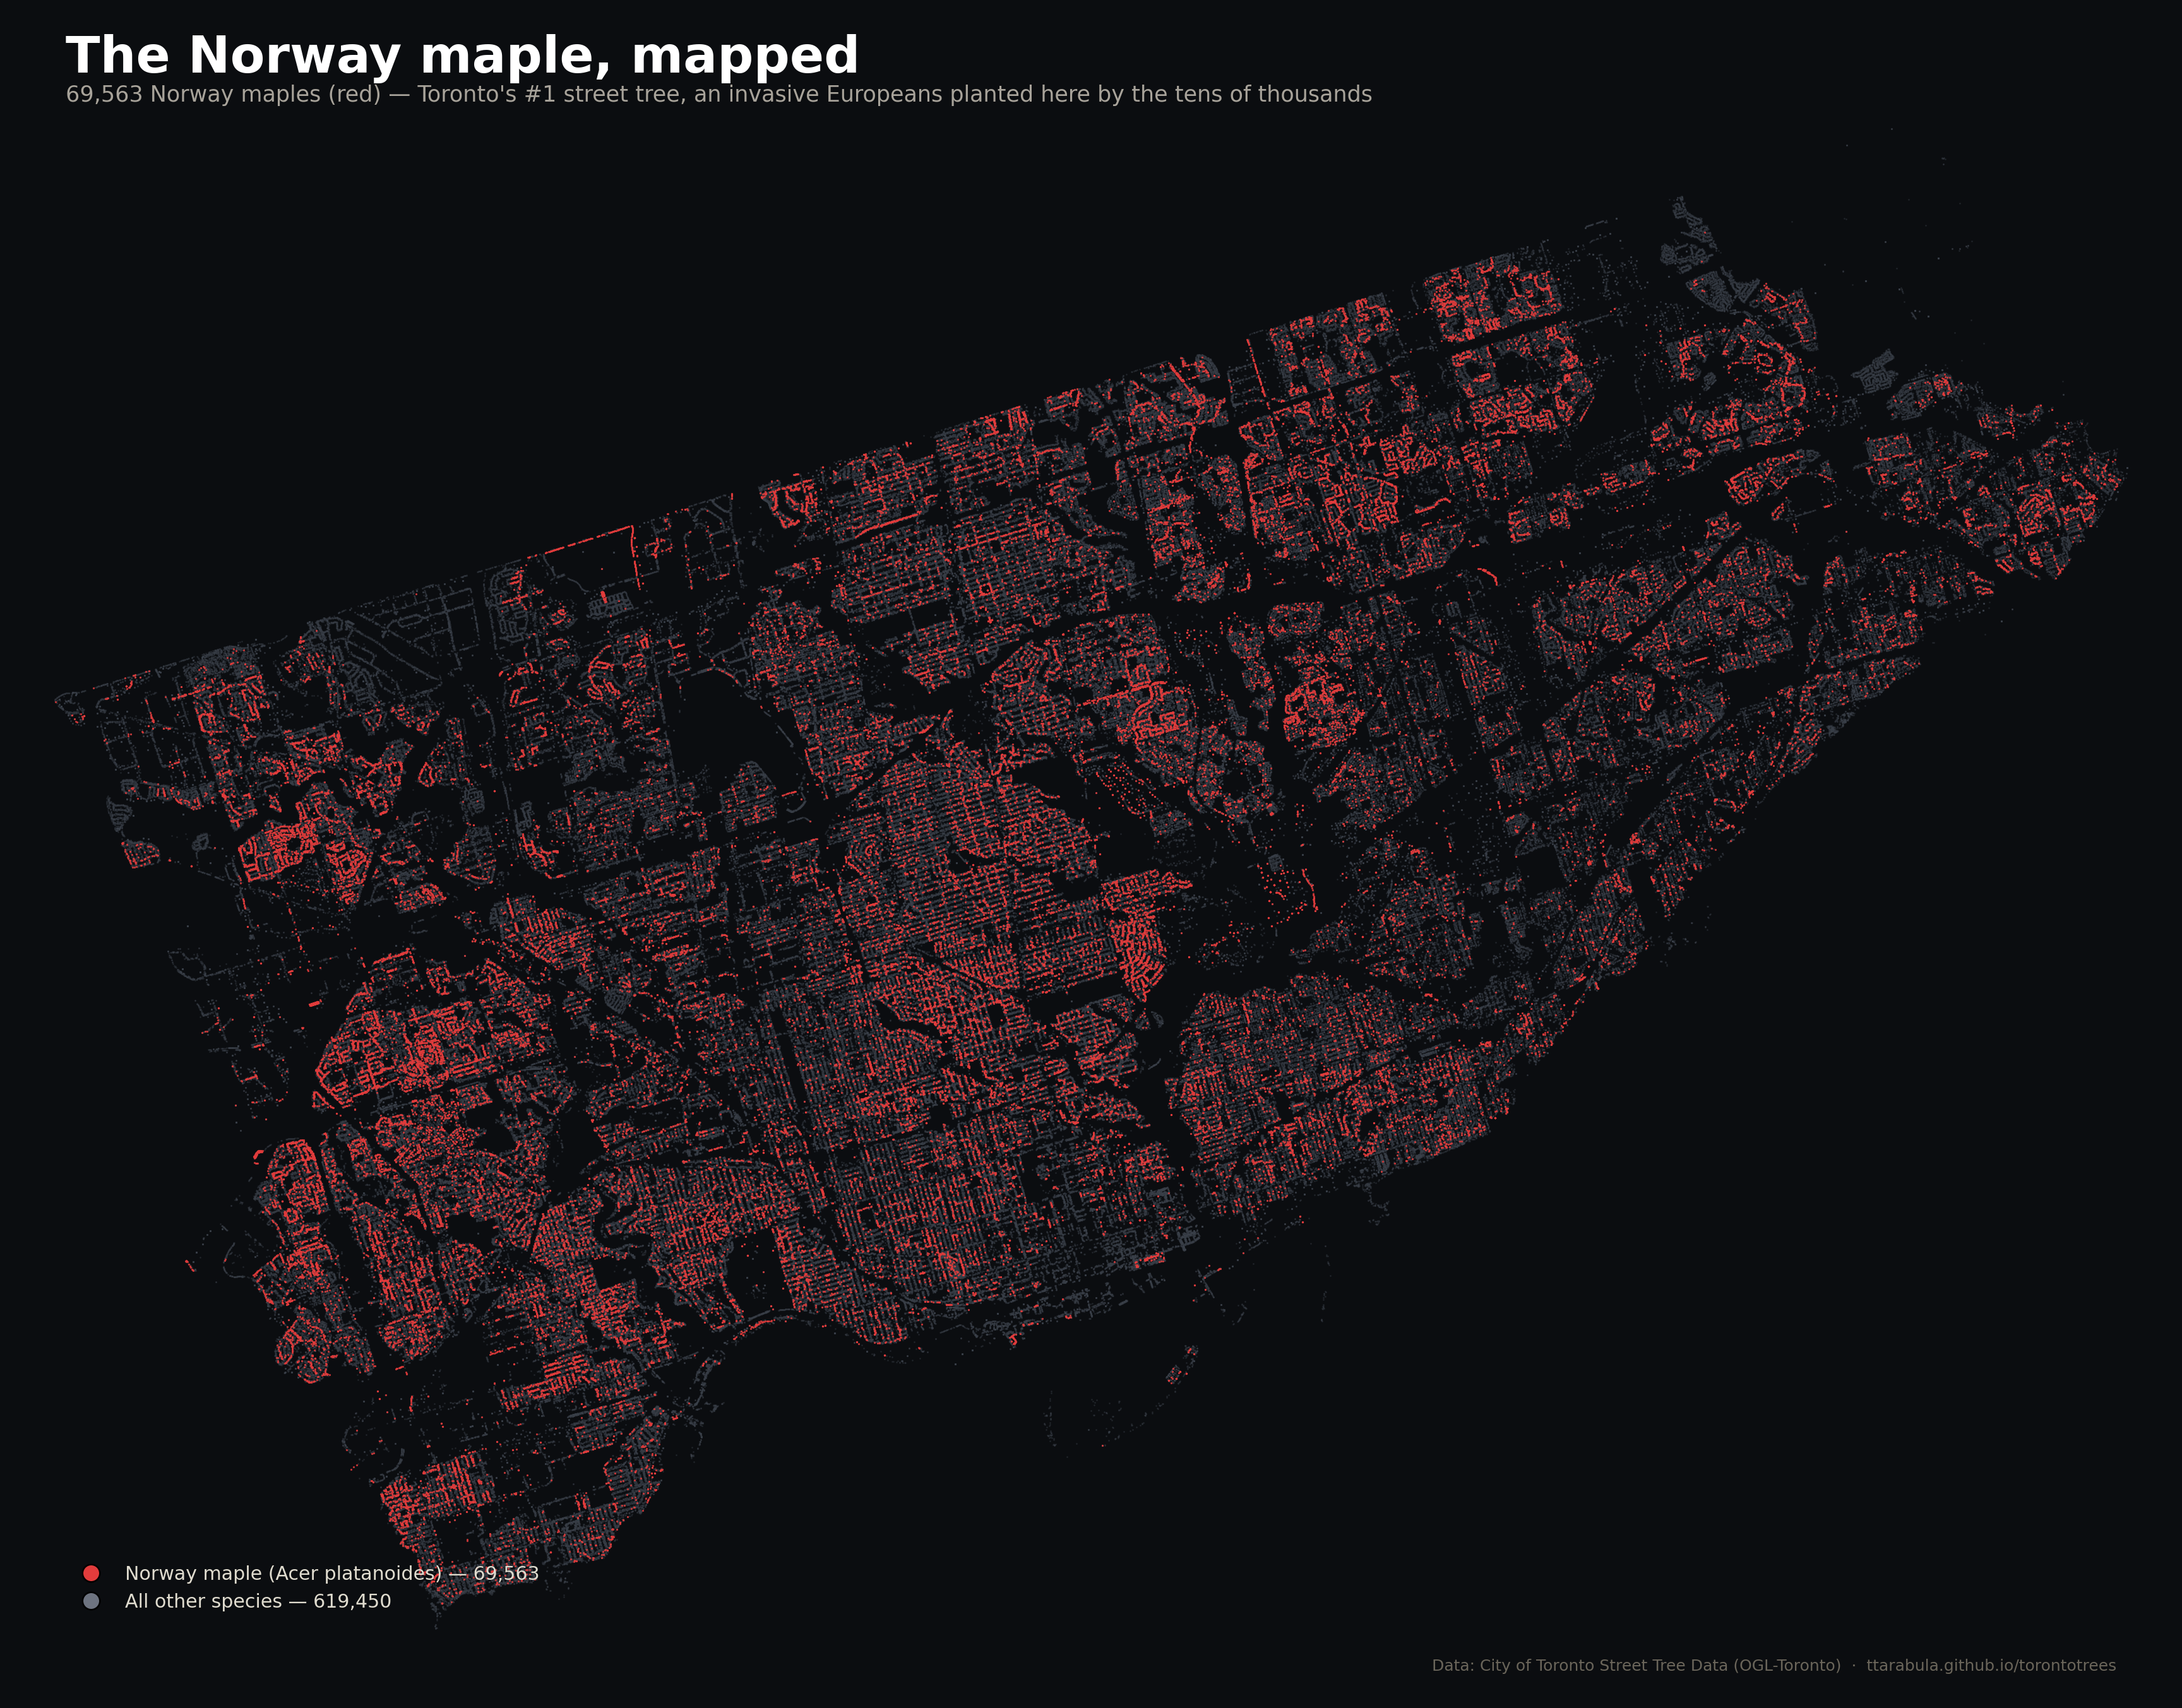
99,931 of them, 14.5% of the entire street-tree canopy, 26% of the mature trees. But under 2% of new saplings. The most successful planting program in Toronto's history is now a 50-year passive removal.
11,000 hectares of protected forest, 17% of the city's land area, and zero of this dataset's rows. On the Don, the Humber, the Rouge — and why Hurricane Hazel in 1954 is the reason Toronto still has them.
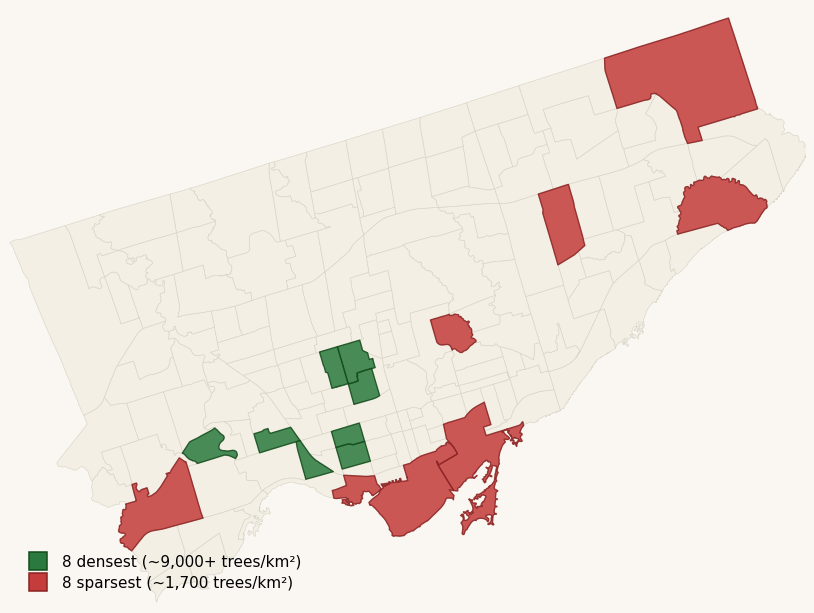
The eight tree-densest neighbourhoods are all pre-1930 rowhouse grids. The eight sparsest are all post-1960 condo waterfronts and tower-in-the-park subdivisions. It isn't income — it's whether there's a boulevard to plant in.
A reflection. The West Lodge elm that outlived its species' pandemic. The Spadina bur oak older than the Annex. The single pawpaw in Roncesvalles. The quieter reasons this project exists.
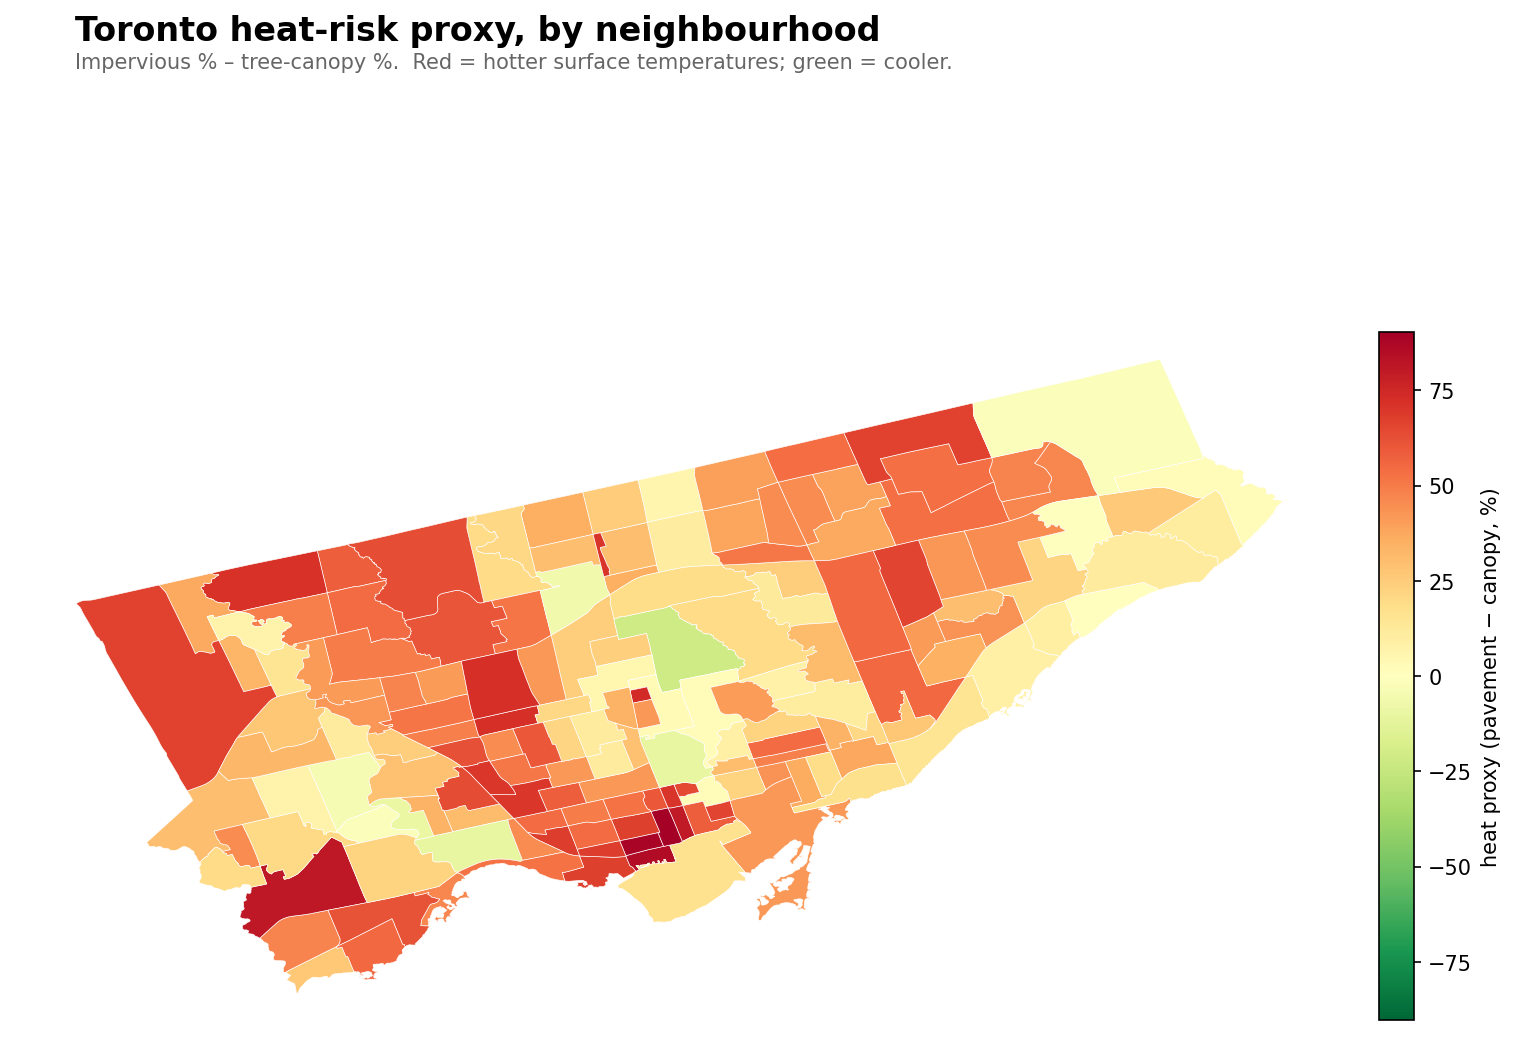
The hottest neighbourhoods in Toronto are the financial-district condo cores, not the NIAs. A heat-risk proxy from impervious-minus-canopy, and what it means for who actually experiences the heat.
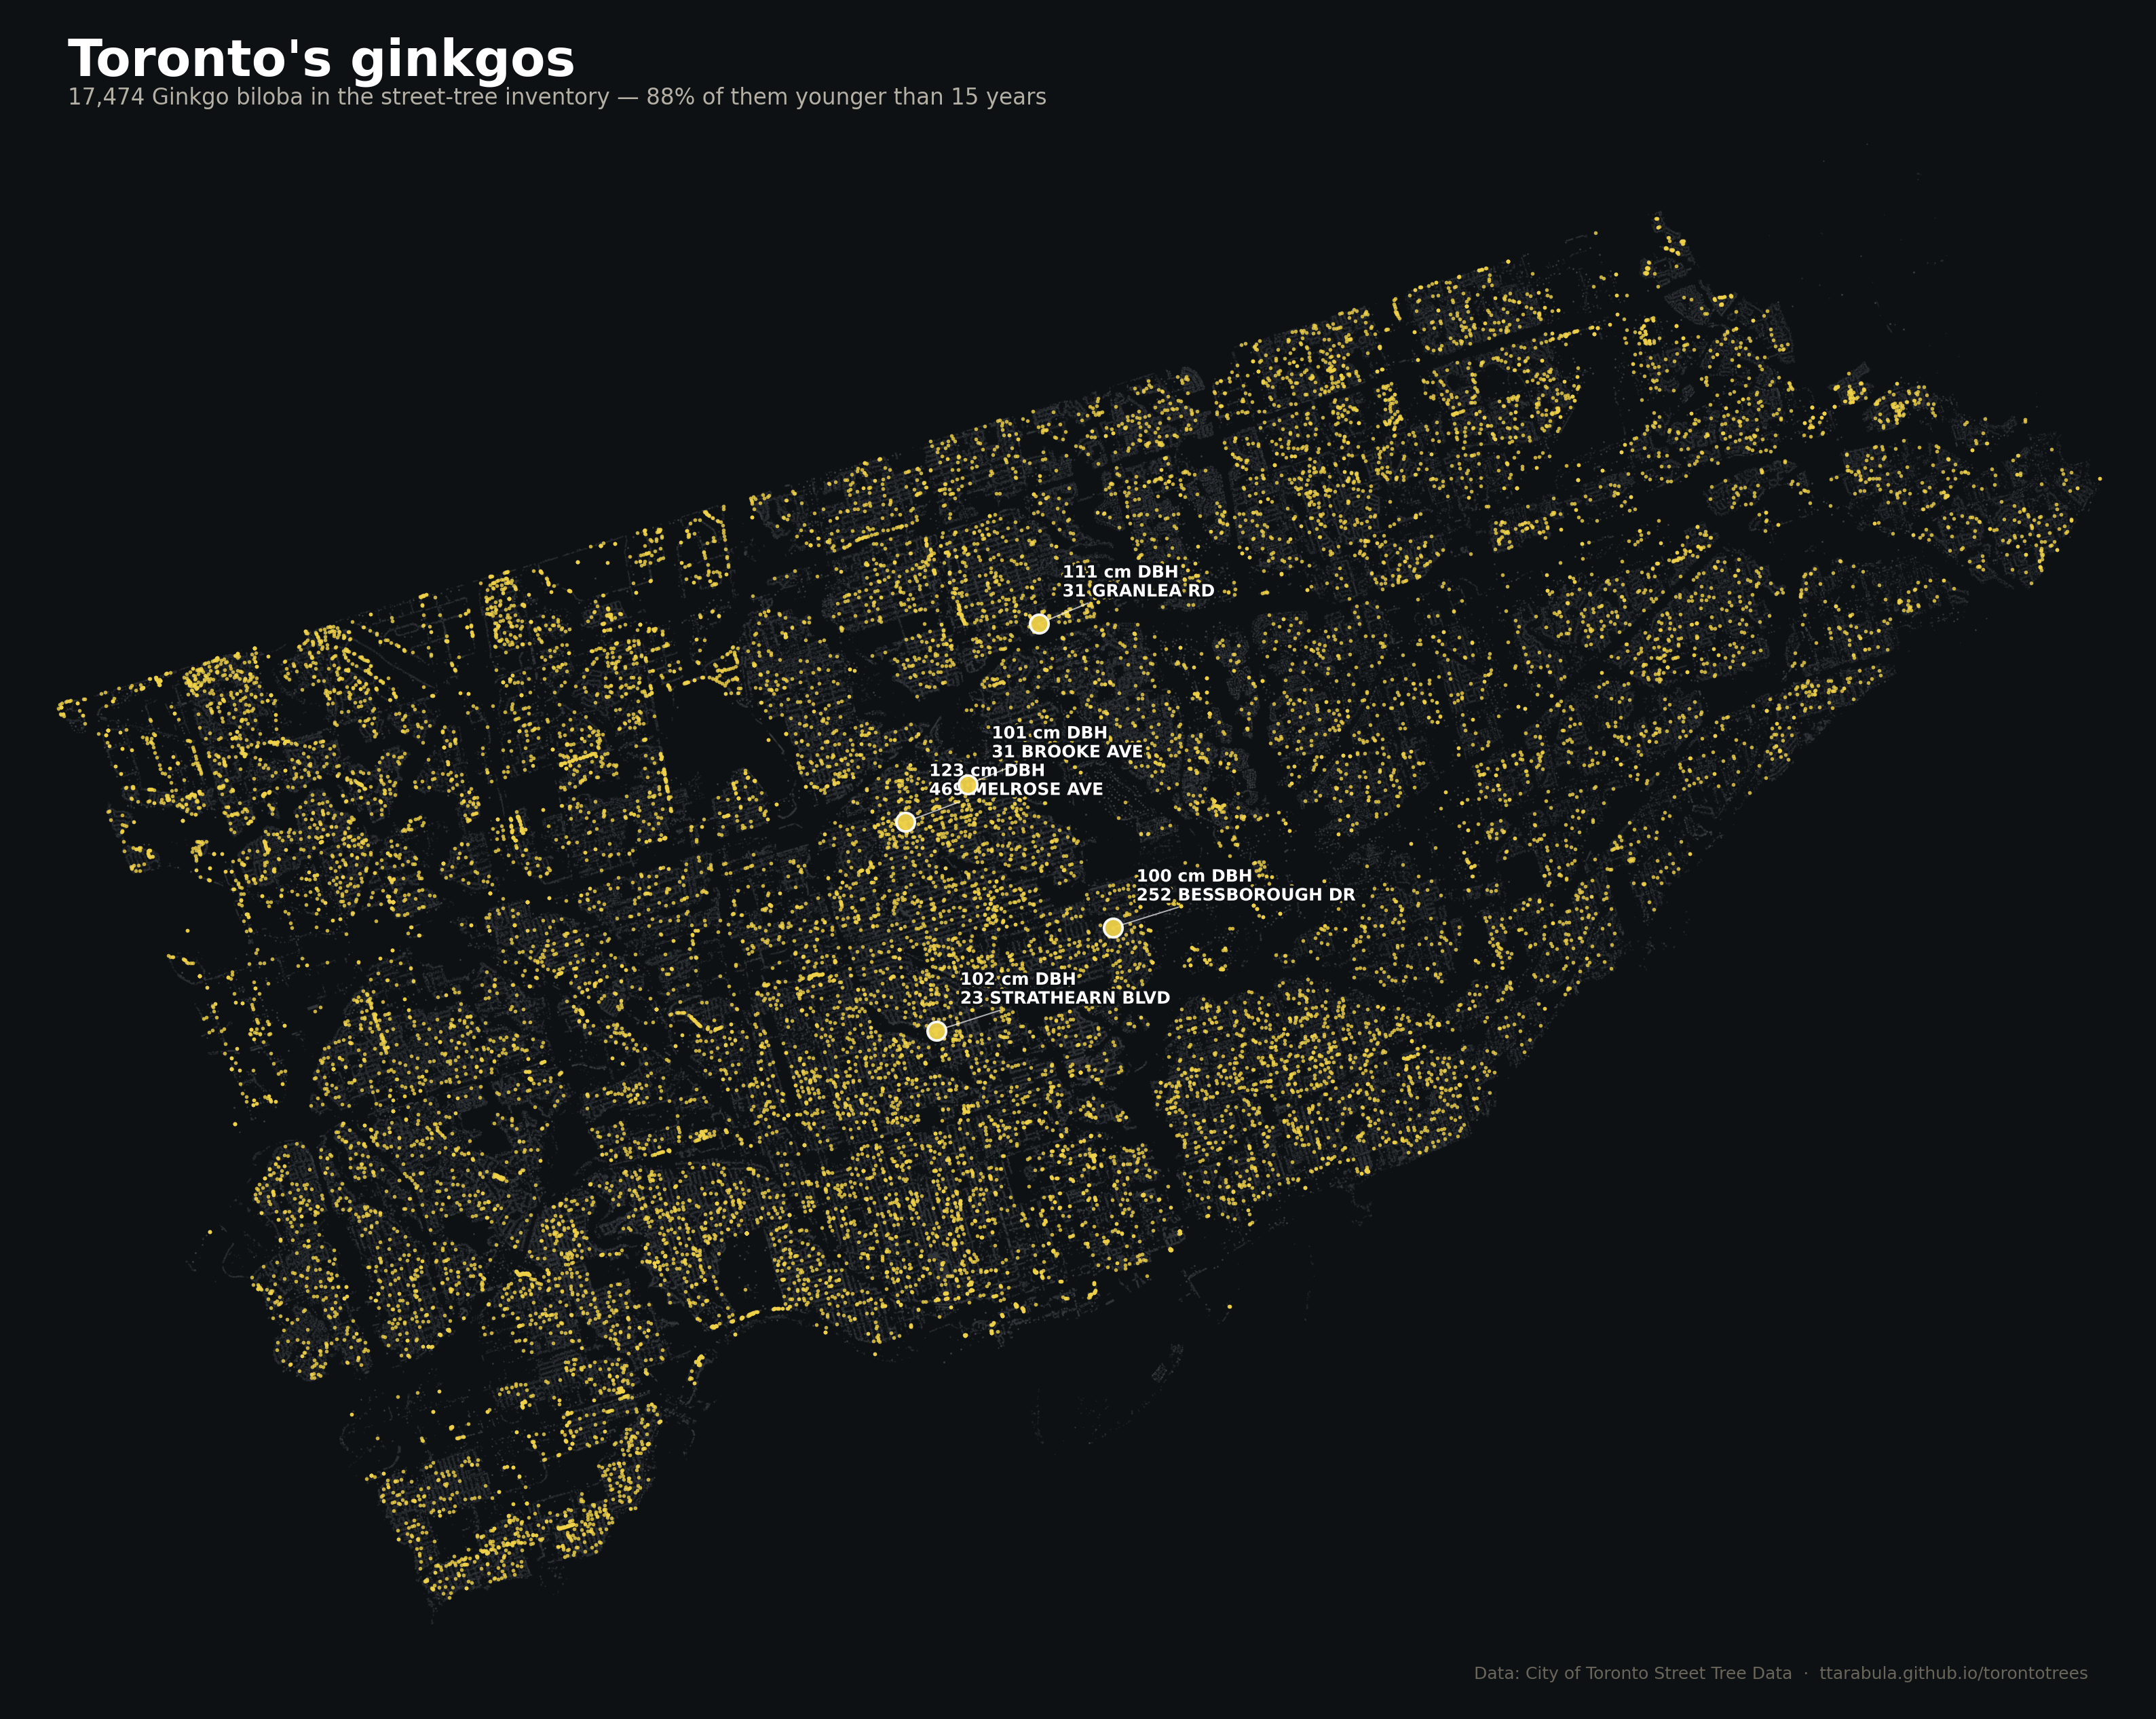
Species portrait #3: a 270-million-year-old lineage the city has quietly started planting everywhere. 88% of Toronto's ginkgos are under 15 years old. Plus the overnight leaf drop and the Hiroshima survivors.
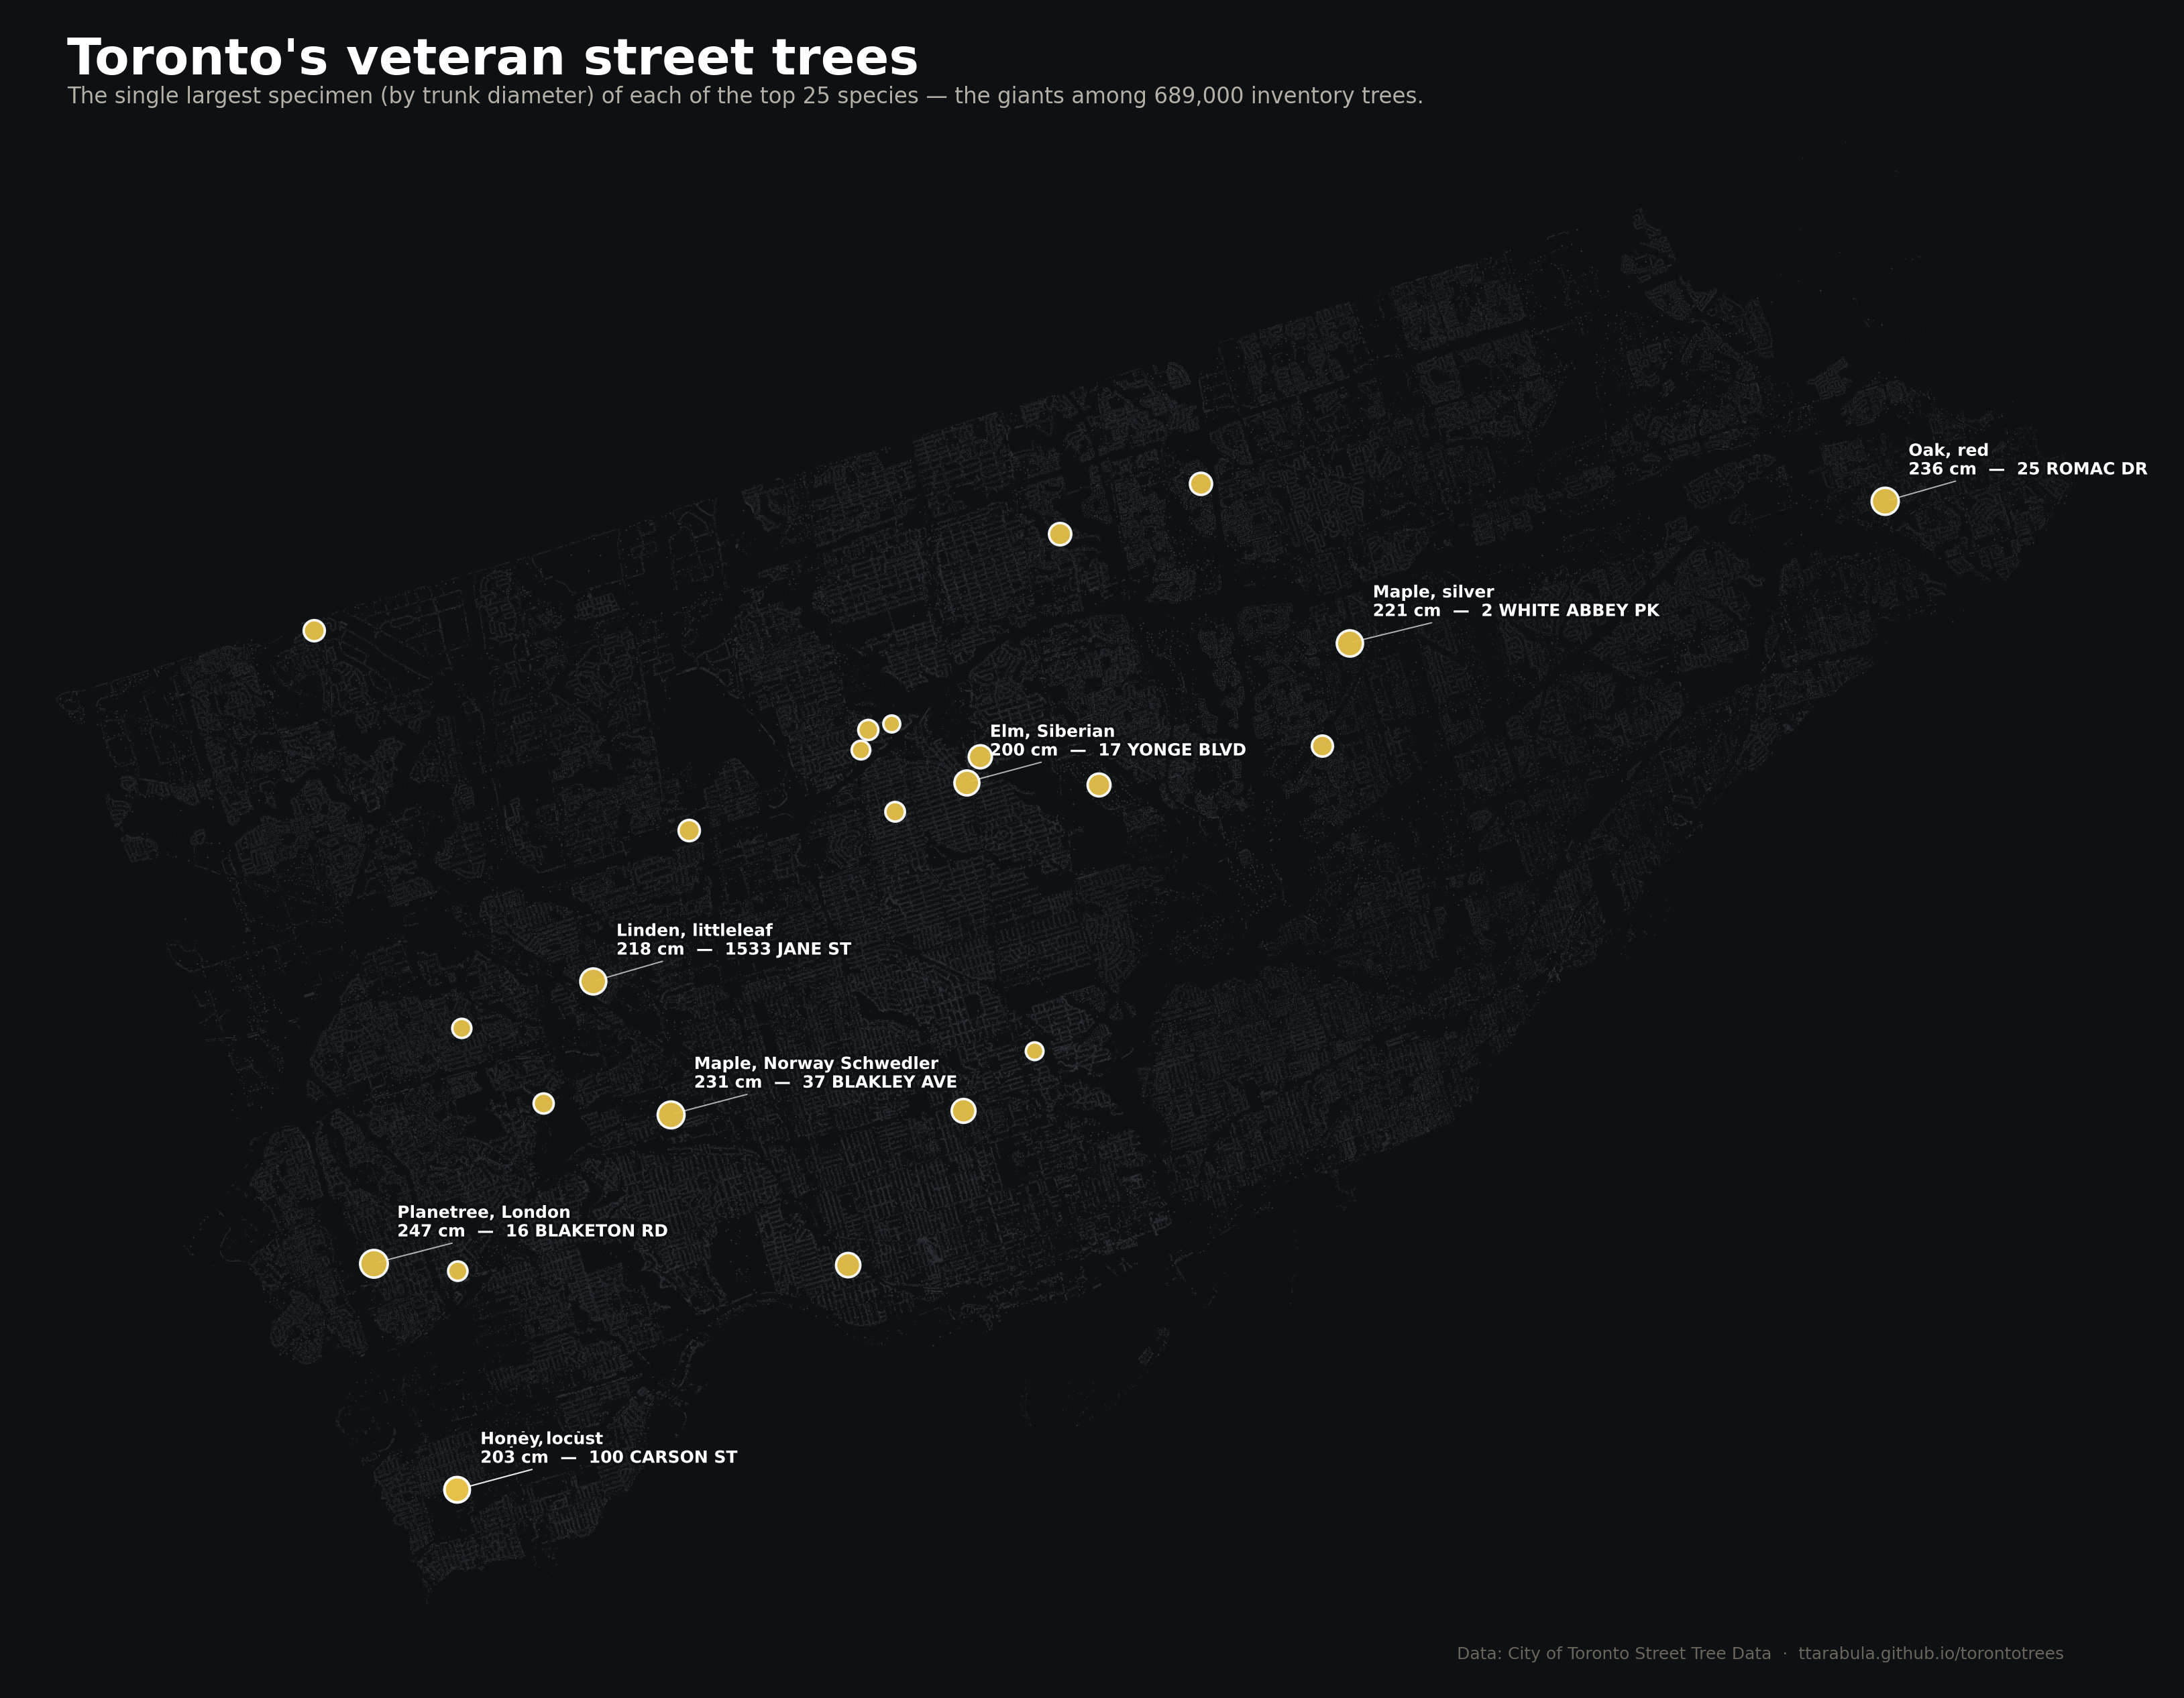
A hall of fame: a 247-cm London plane, a 236-cm red oak, a 190-cm American elm that outlived Dutch elm disease, and 22 more. Each with address + Street View link.
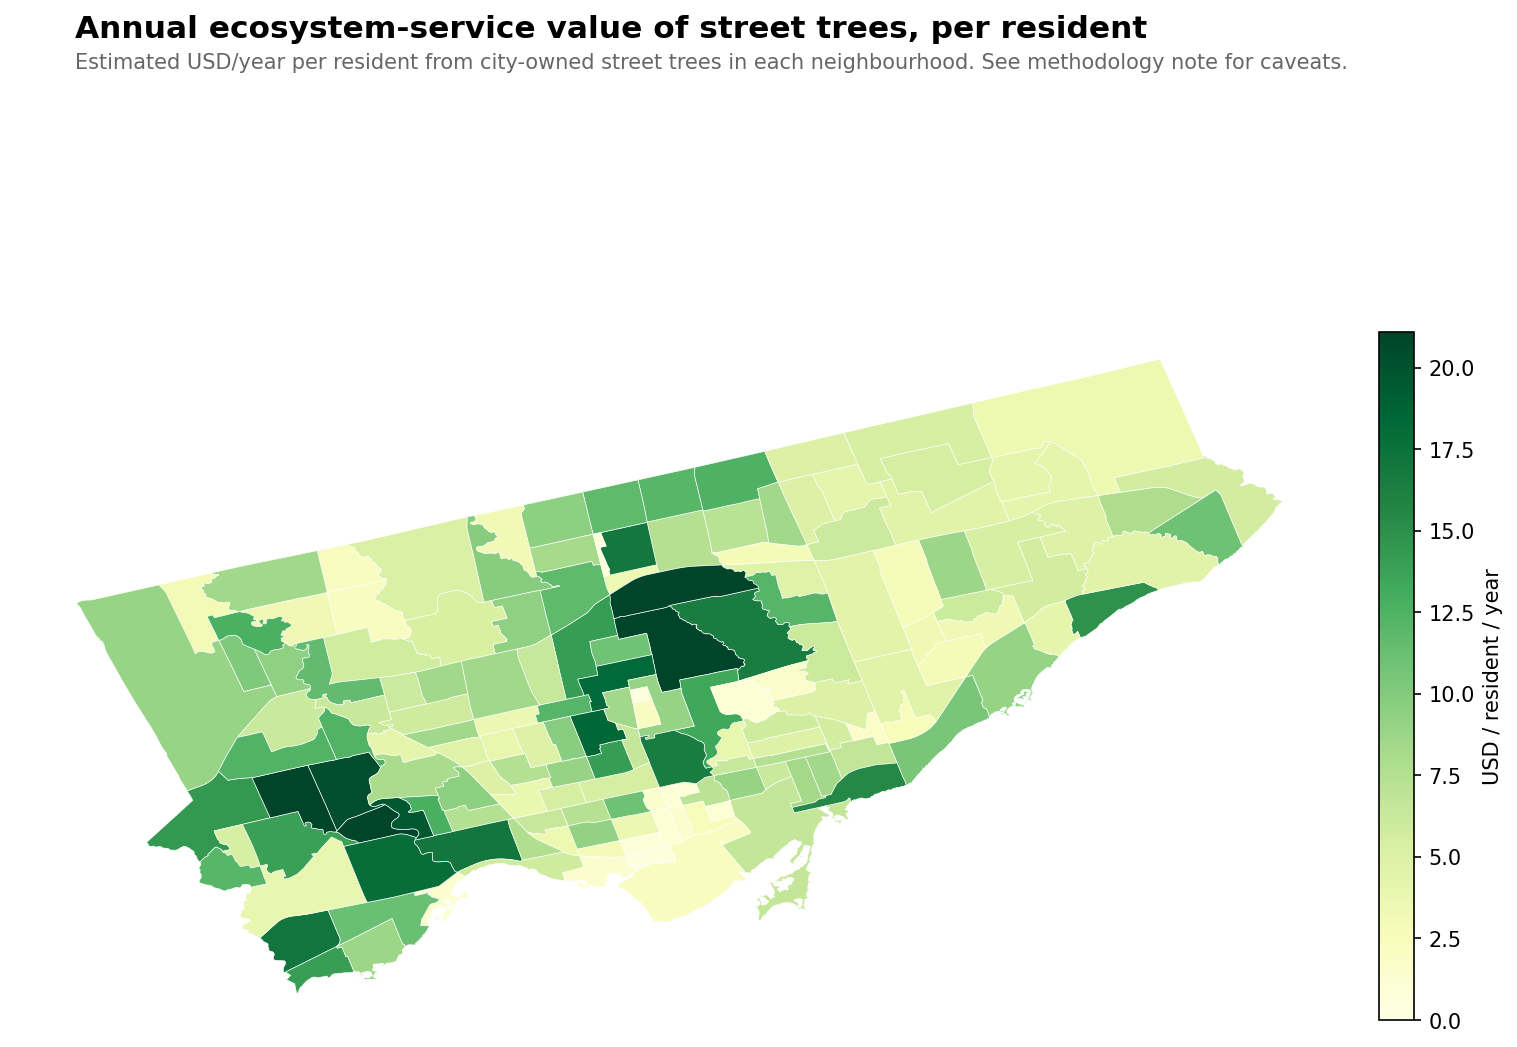
Applying ecosystem-service formulas to every tree: $20M/year total, but Bridle Path gets $40/resident while North Toronto gets 50 cents. The biggest equity gap we've measured — r = 0.76 with income.
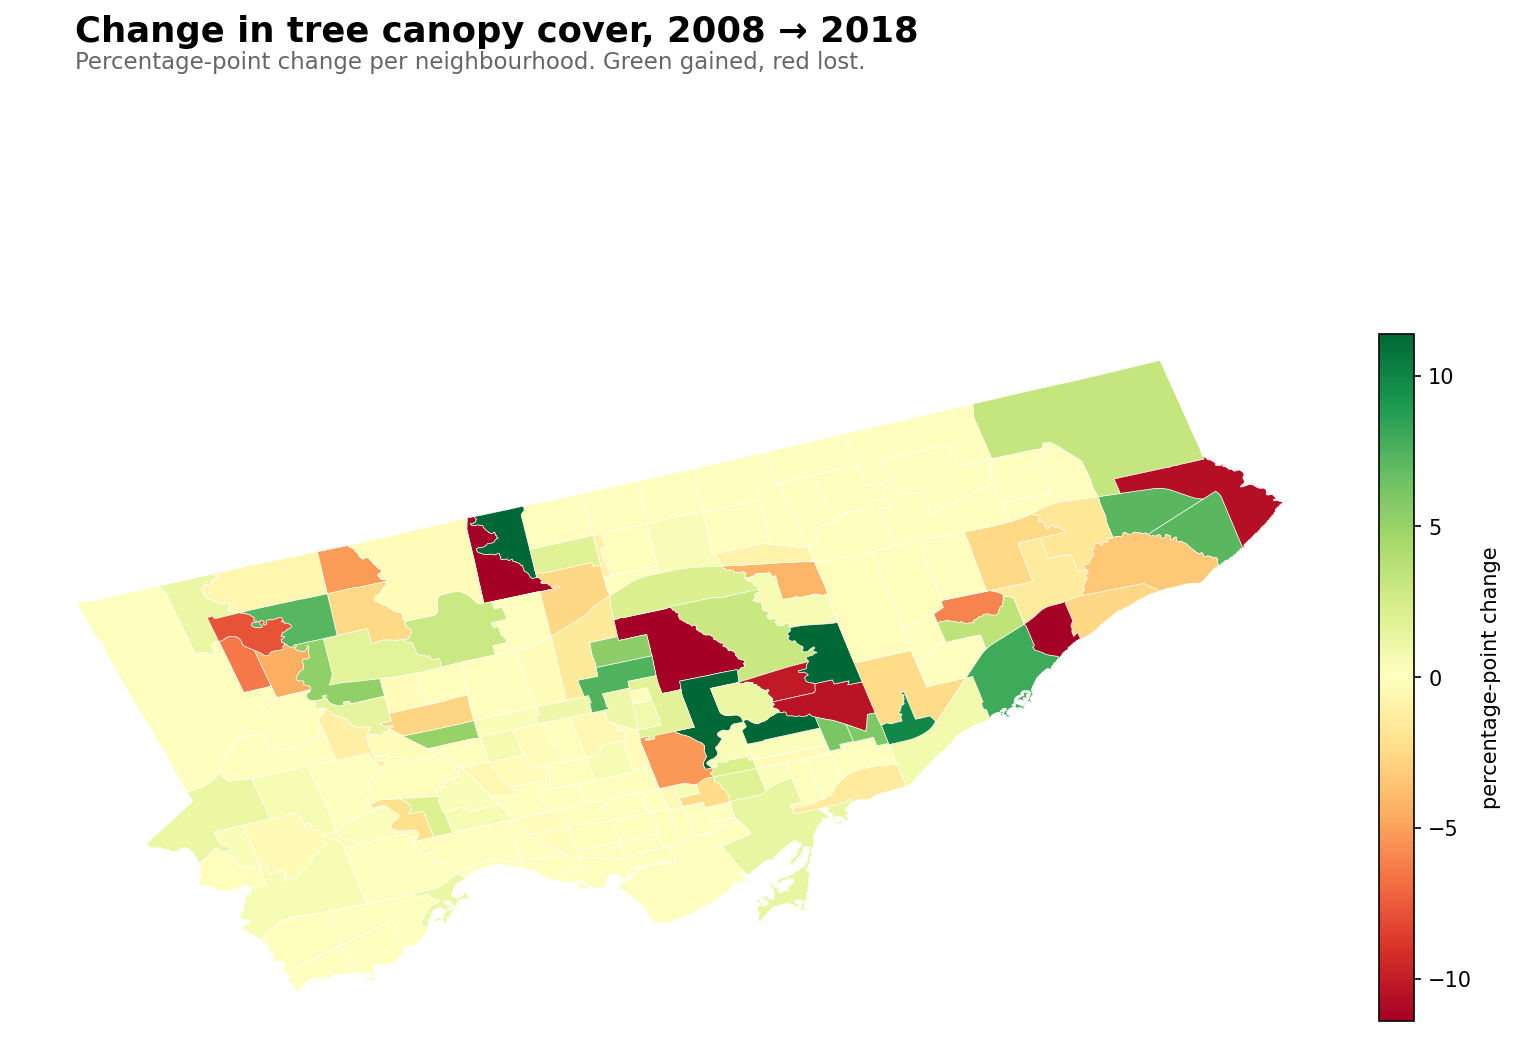
Emerald ash borer killed 80,000+ mature ashes between 2008 and 2018. Citywide canopy stayed flat anyway — at 25.9%. Here's where the invisible compensating work happened.
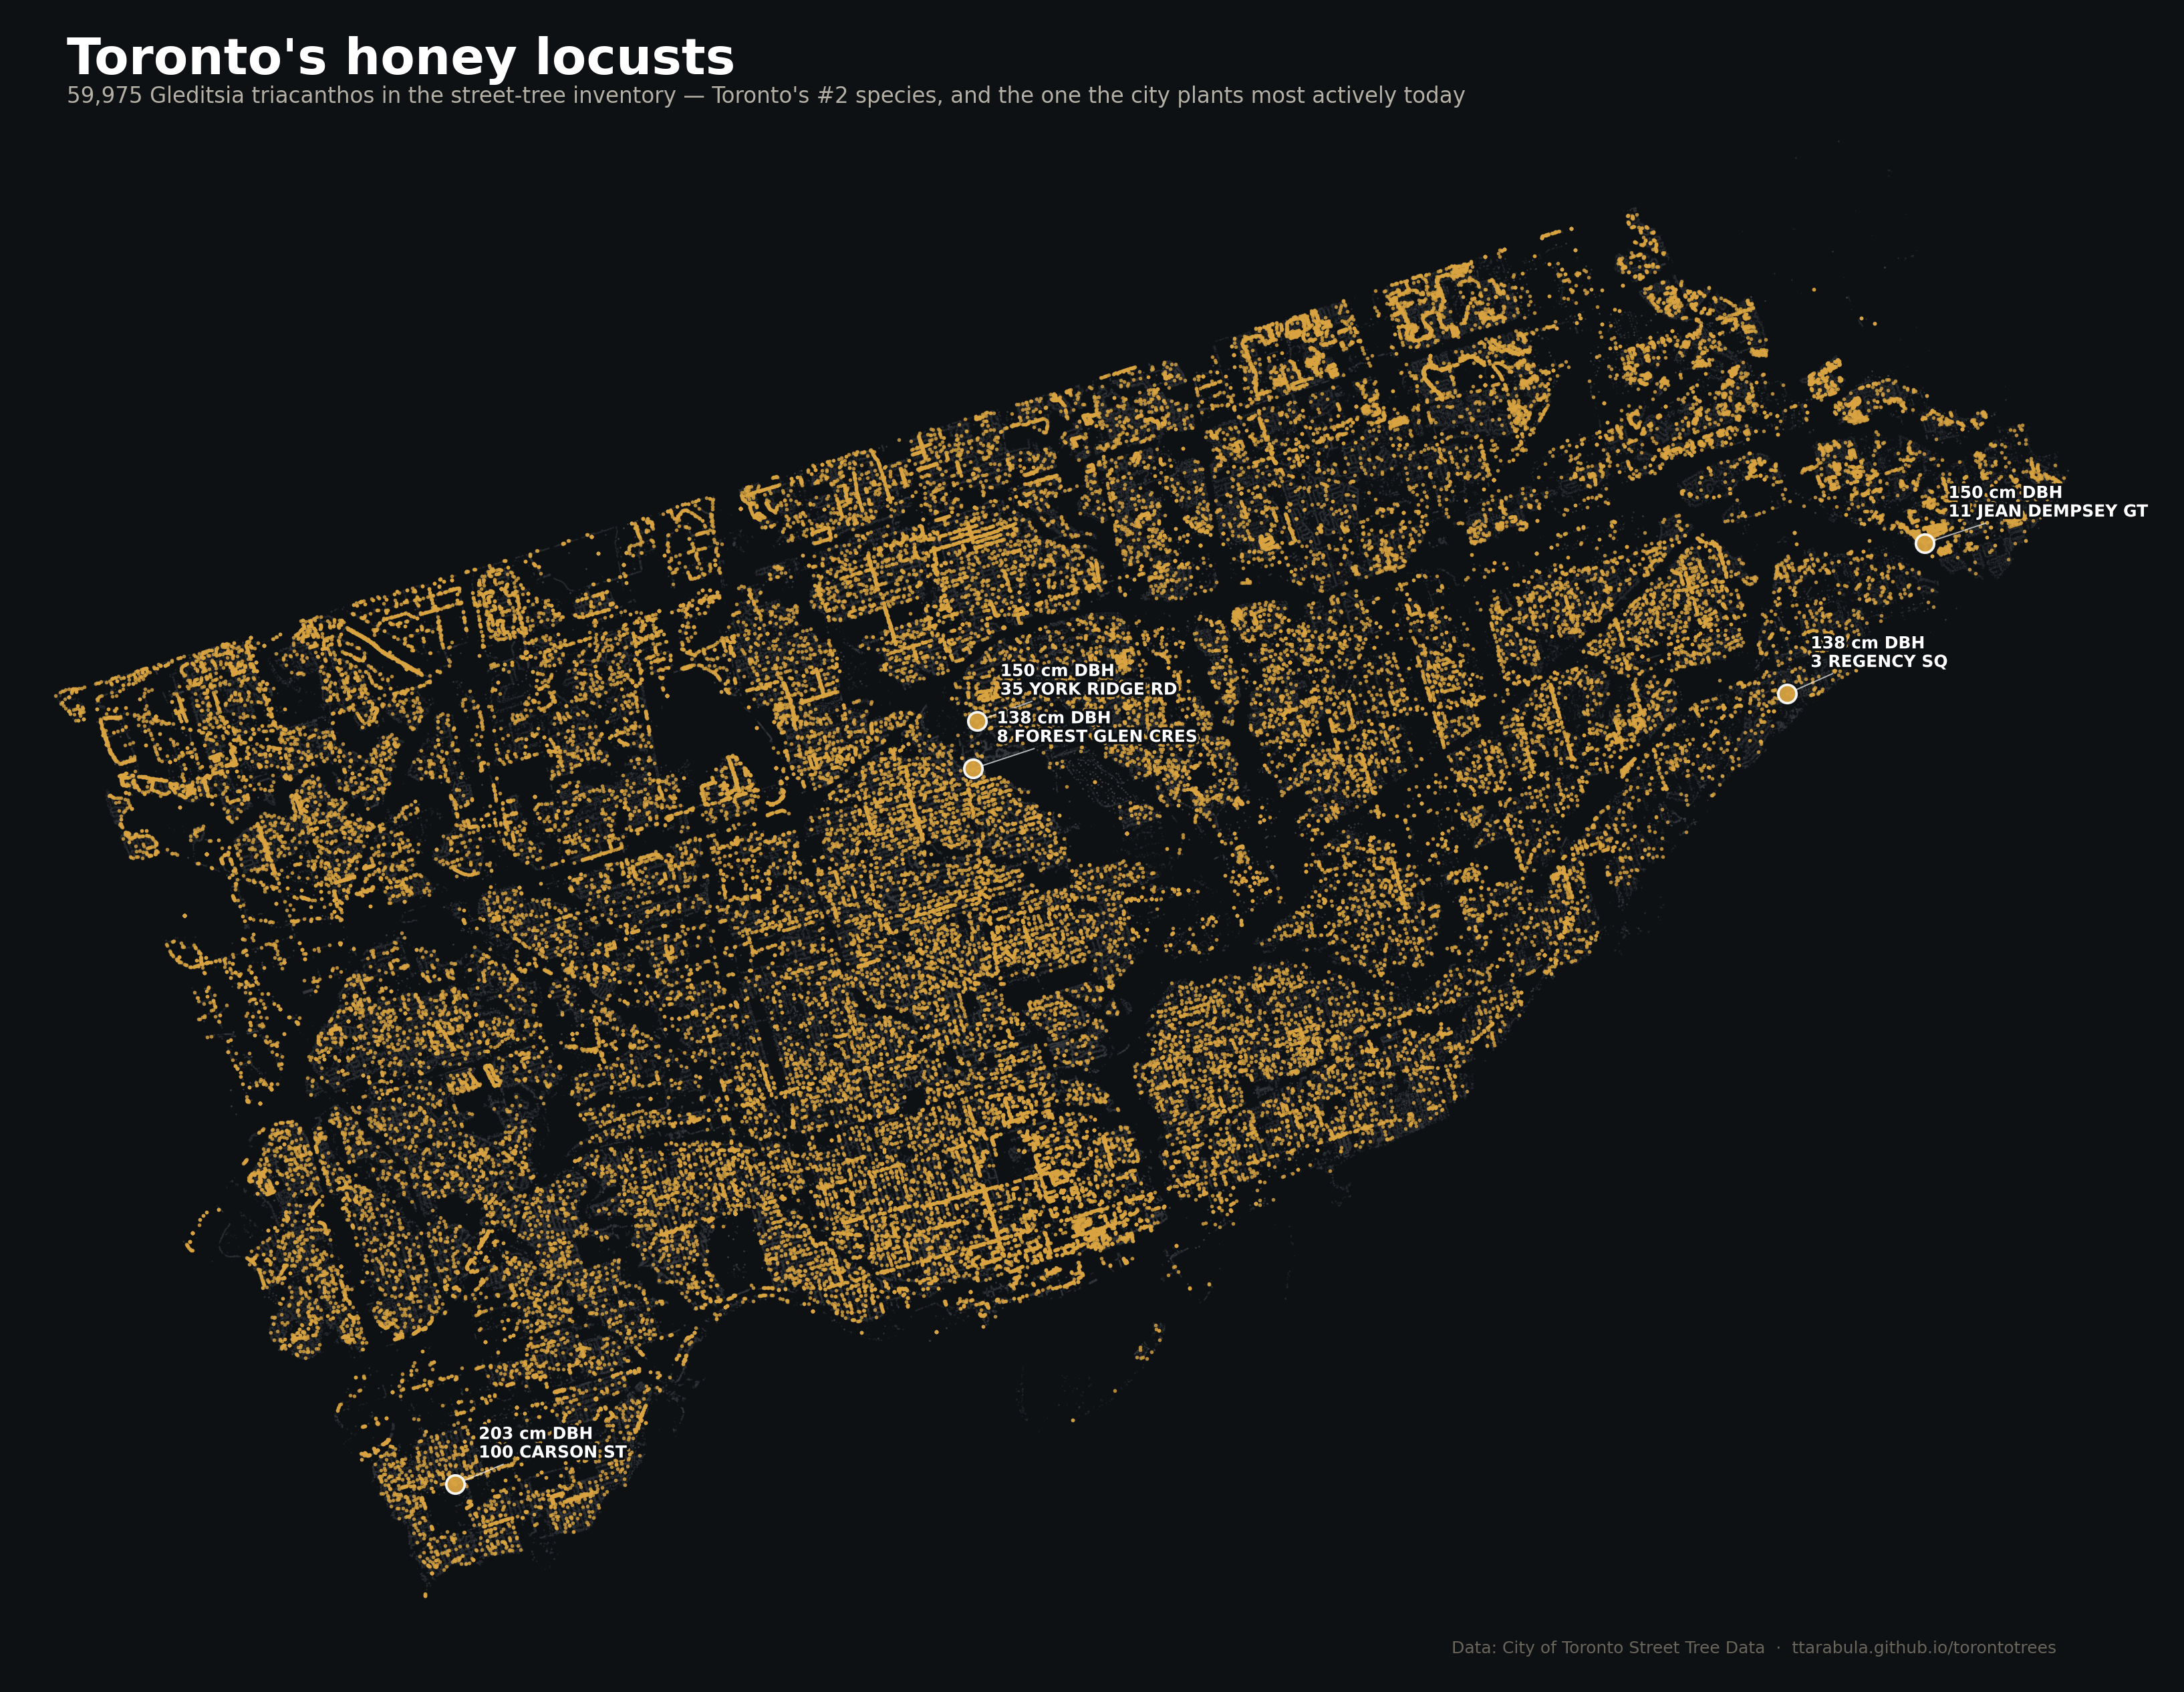
Species portrait #2: 60,000 Gleditsia triacanthos, mostly in thornless-seedless cultivars engineered for the street. The contemporary answer to Norway maple, and the next monoculture risk.
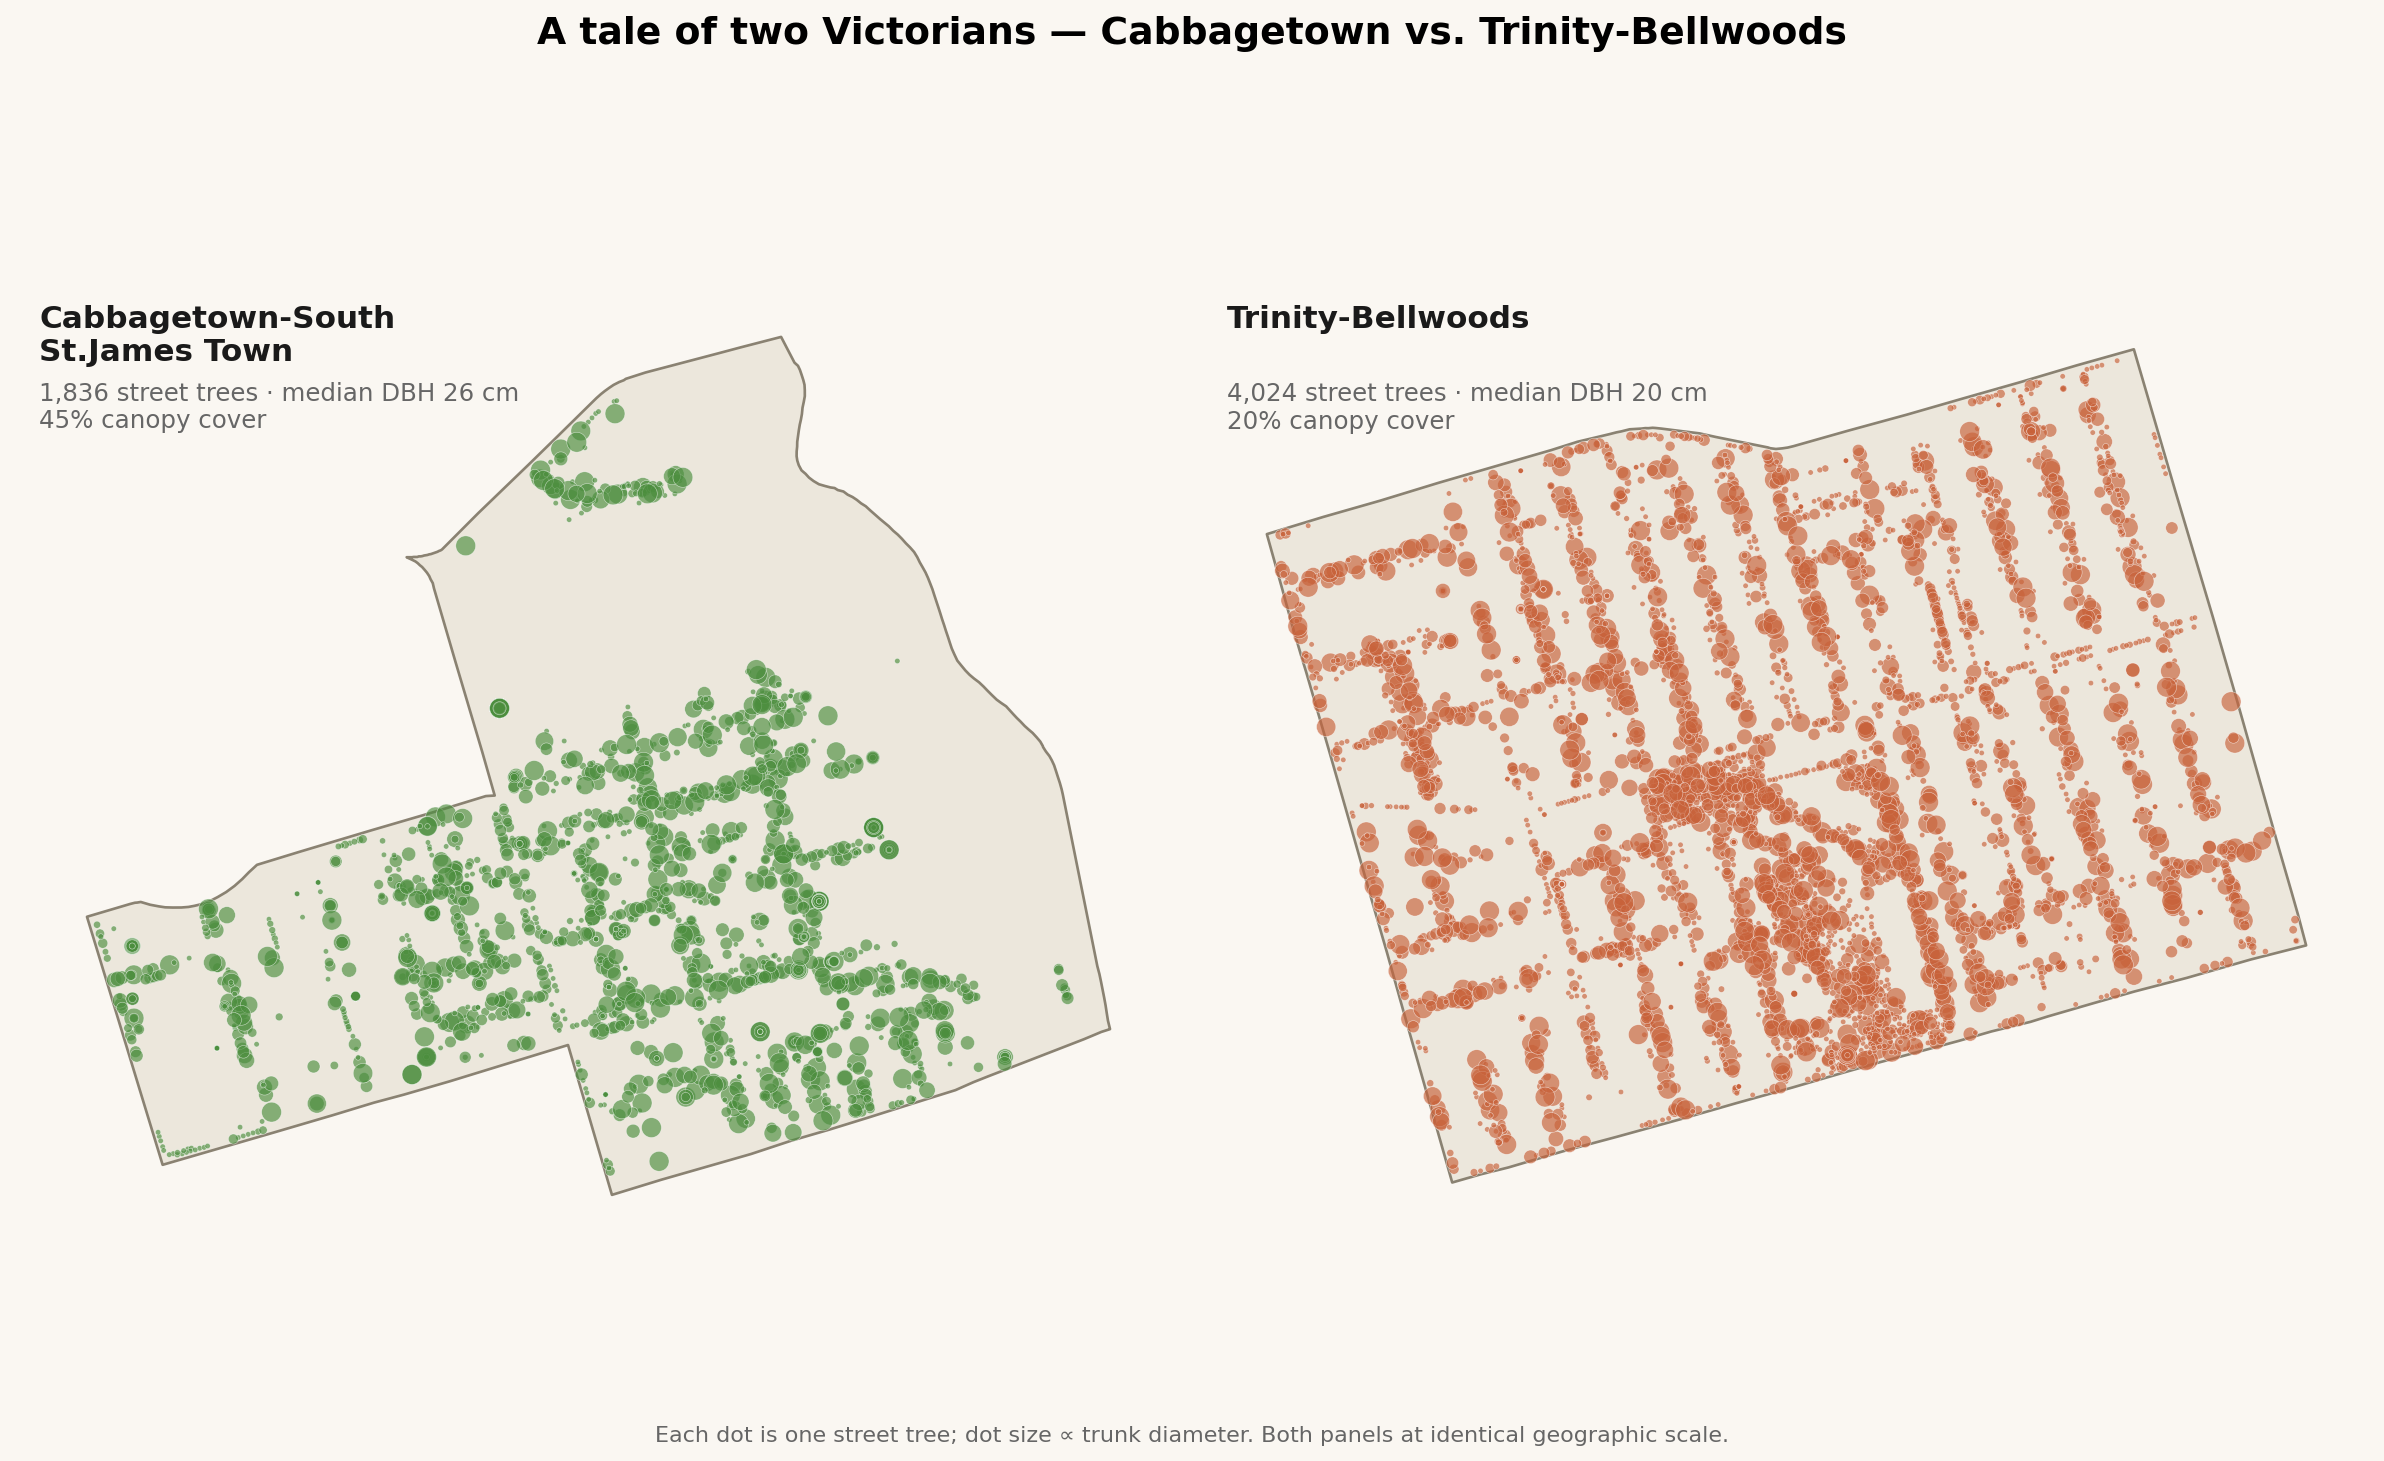
Same era, same rowhouses, same gentrification arc. One has 45% canopy, the other 20%. The answer isn't planting — it's built form.
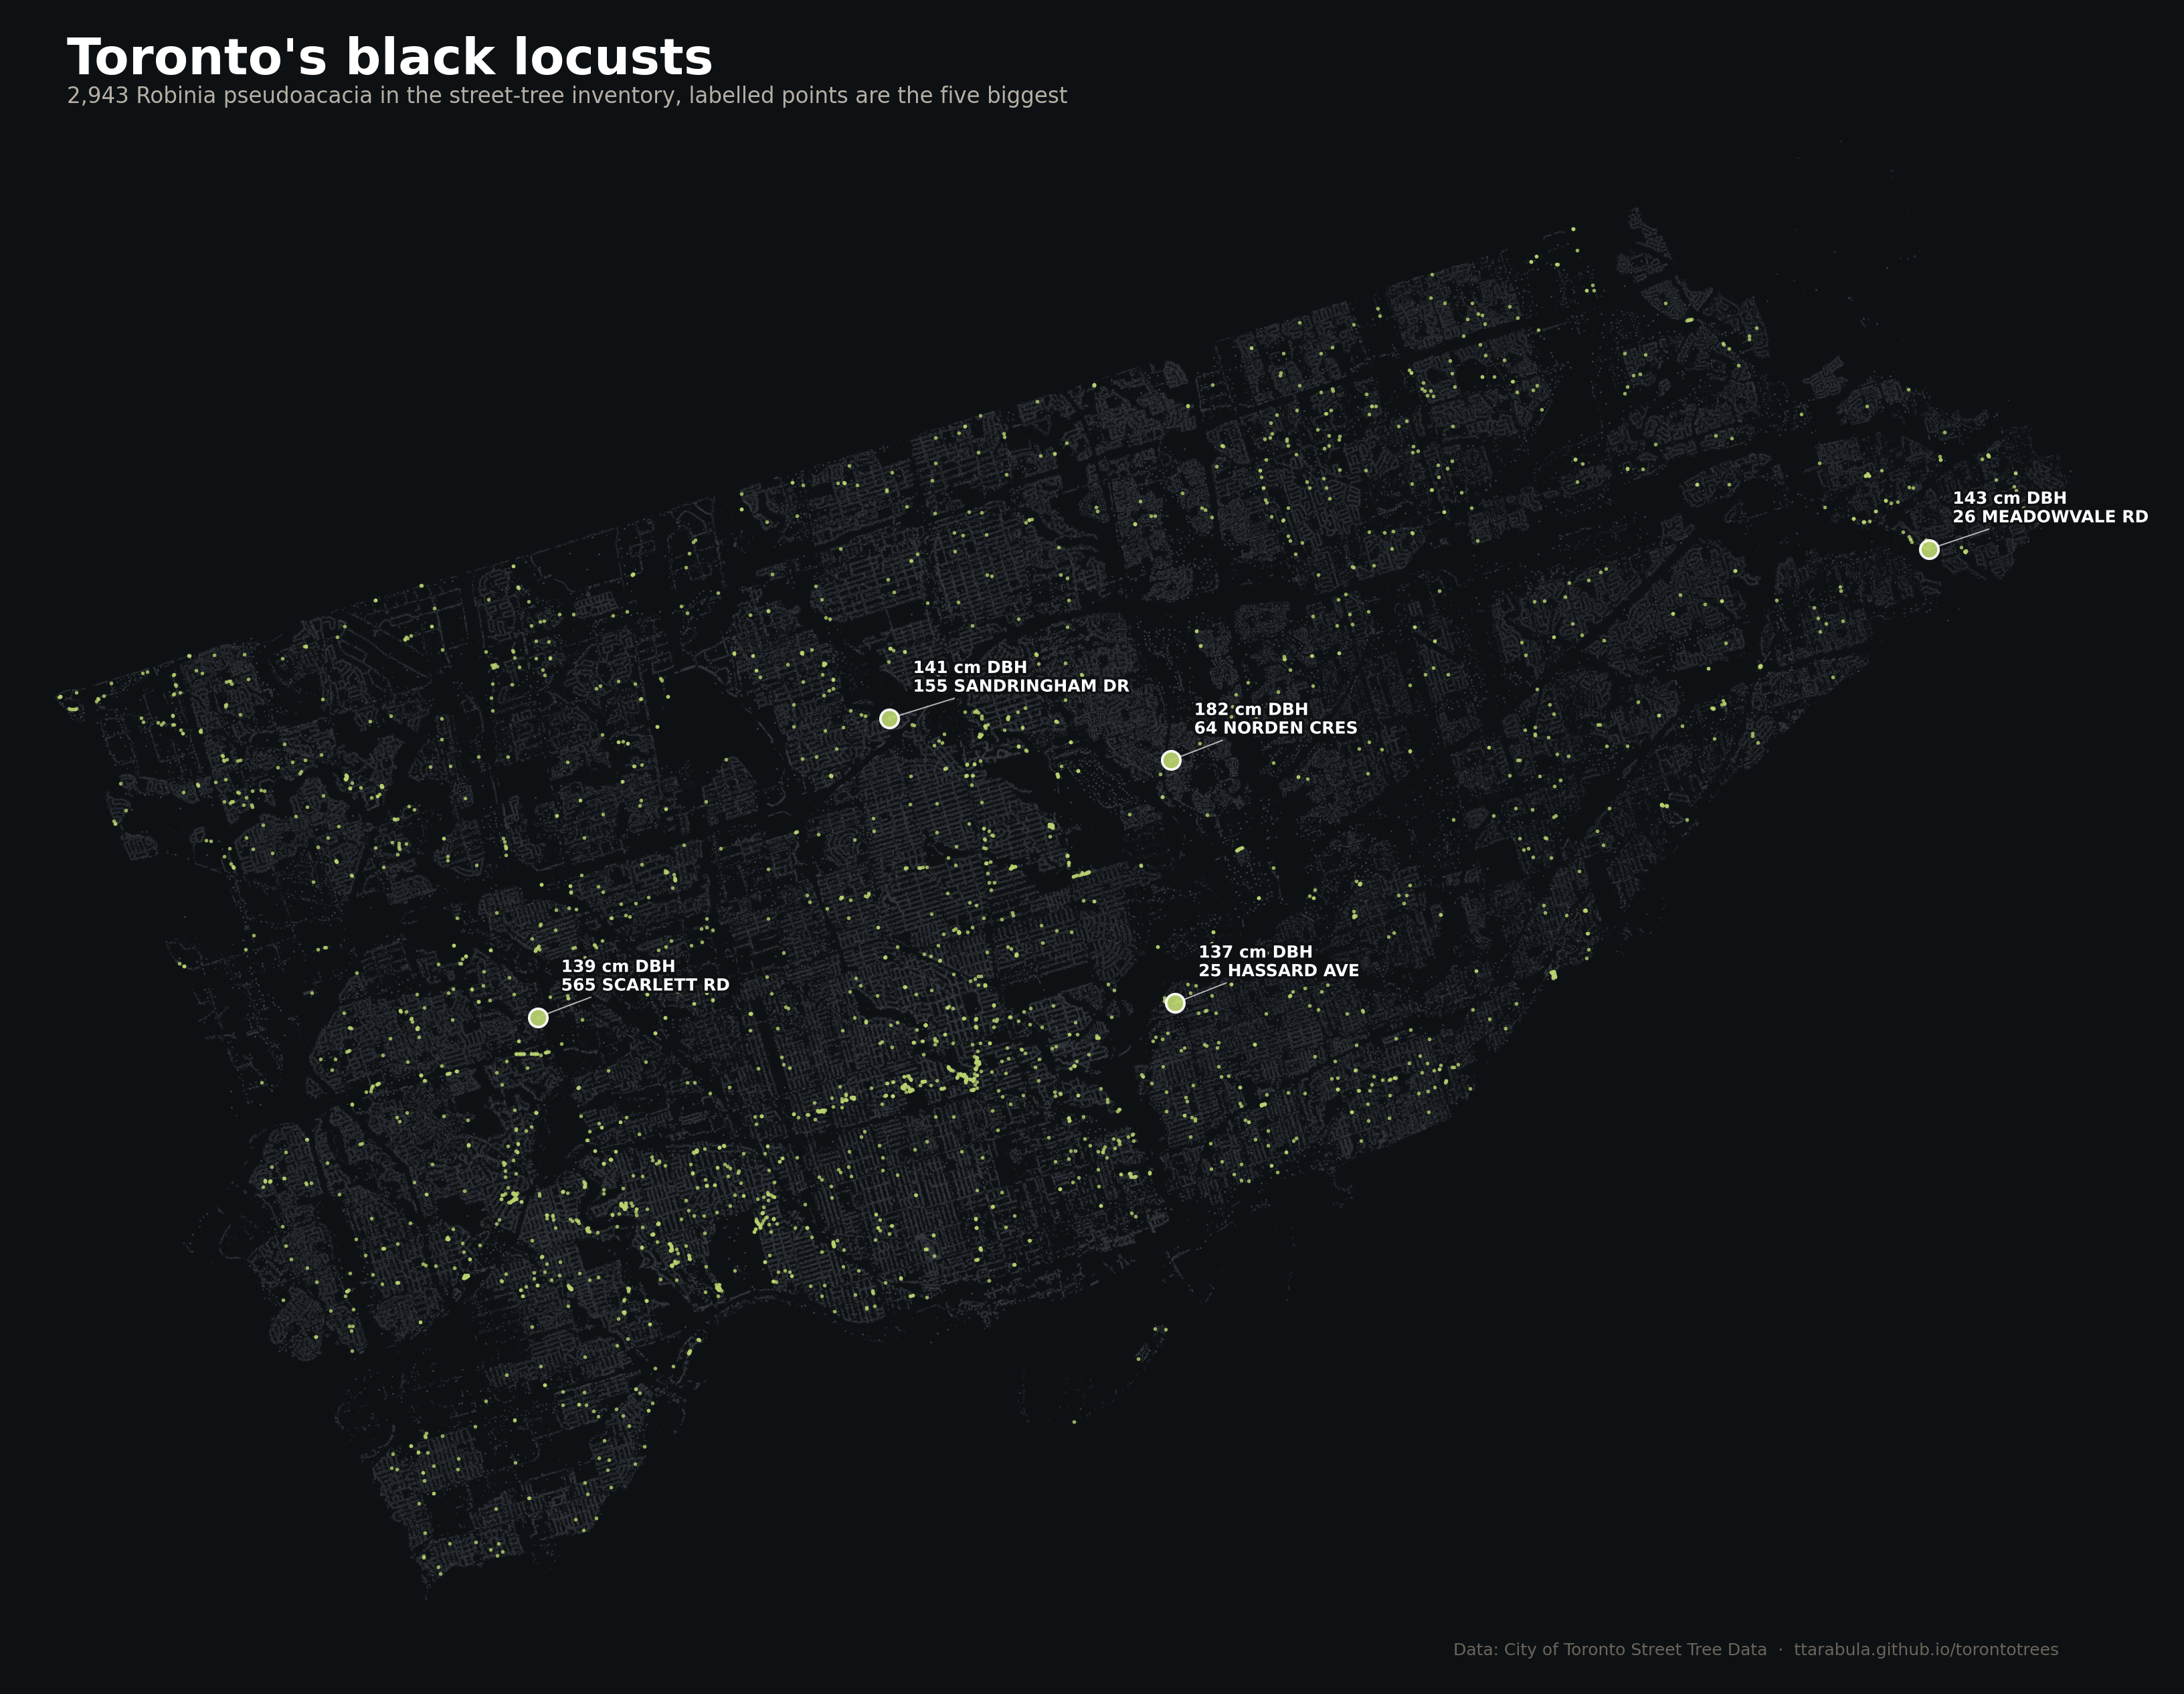
A species portrait: the honey-scented flowers, the wood that outlasts its post, the 182-cm giant in Don Mills, and why it's a perfect laneway tree.
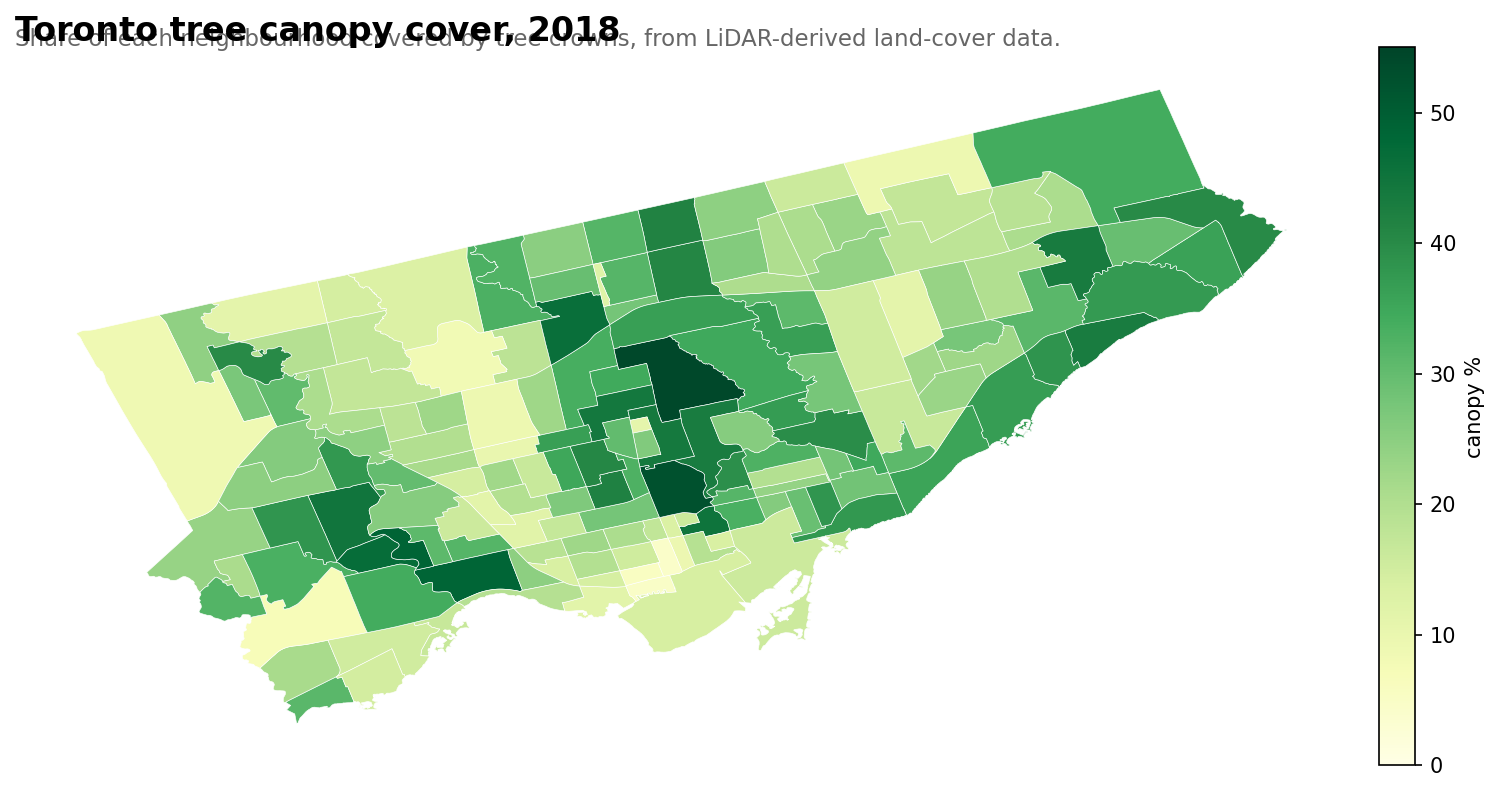
LiDAR-derived canopy data shows the city-wide cover is 25.9%. More importantly: the equity gap is 2.5× bigger on public land than on private land.
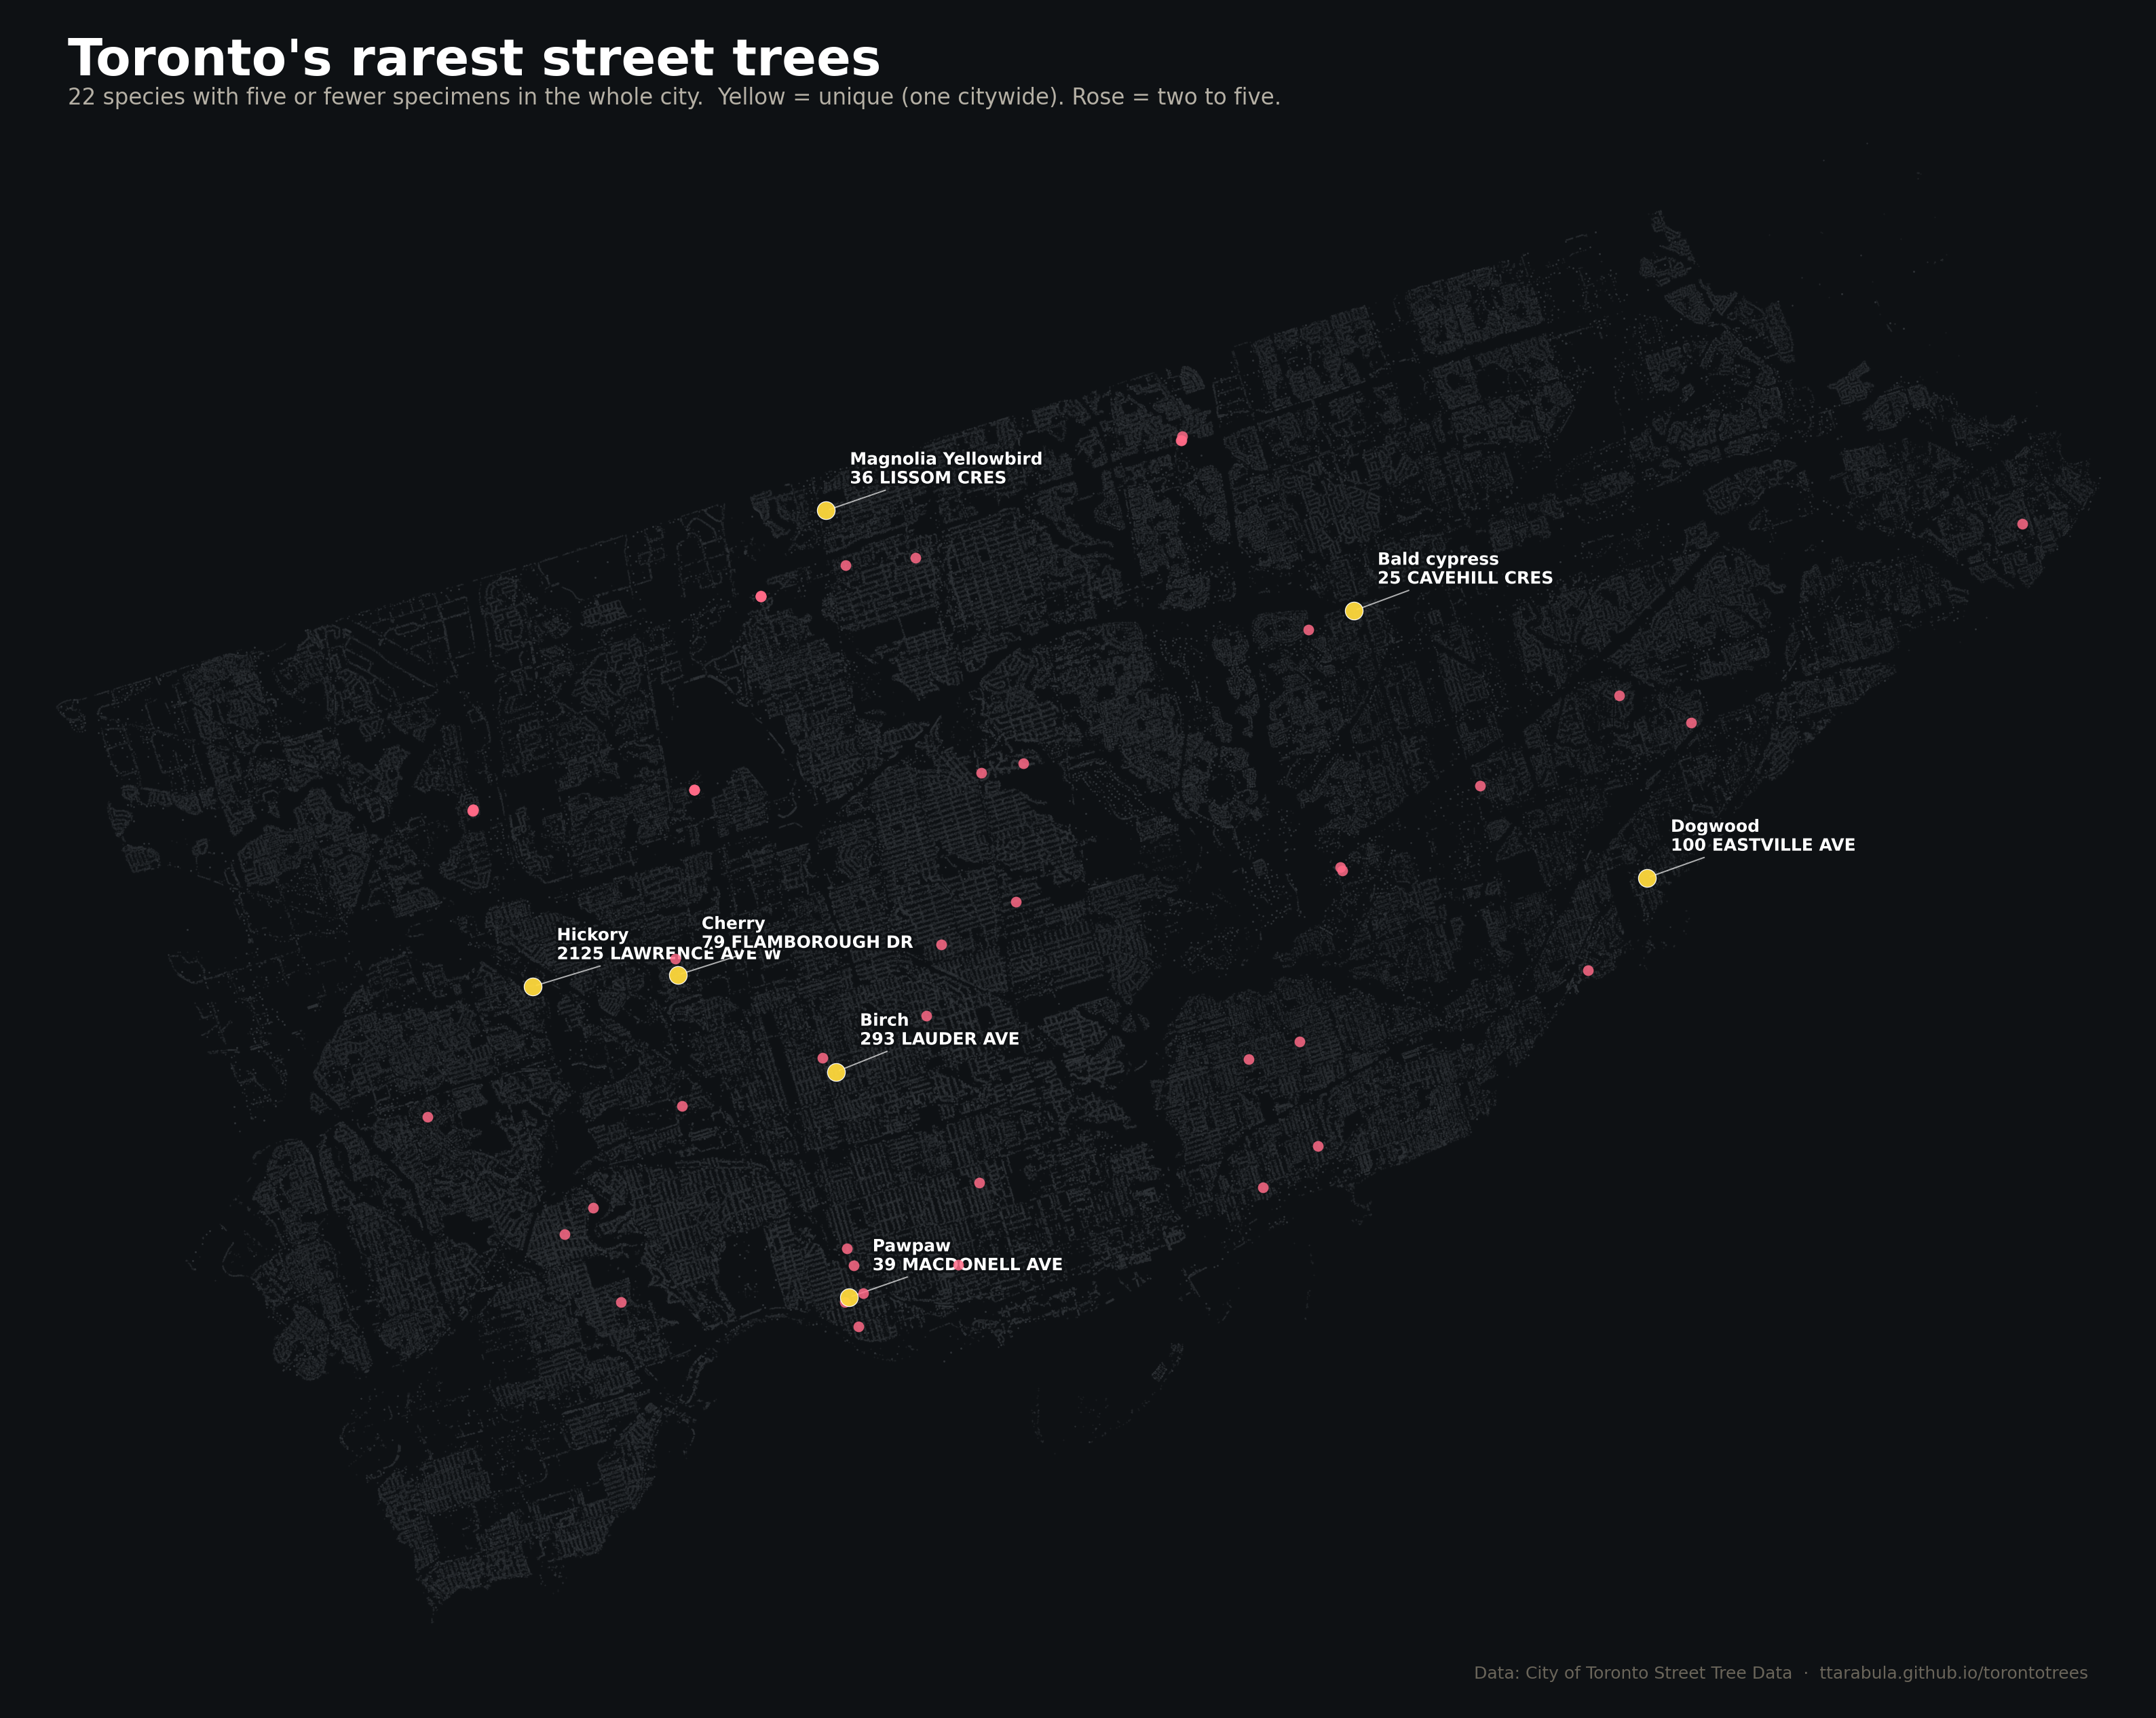
A pilgrimage guide. Where to find the city's only pawpaw, its only bald cypress, and twenty other species with five specimens or fewer.
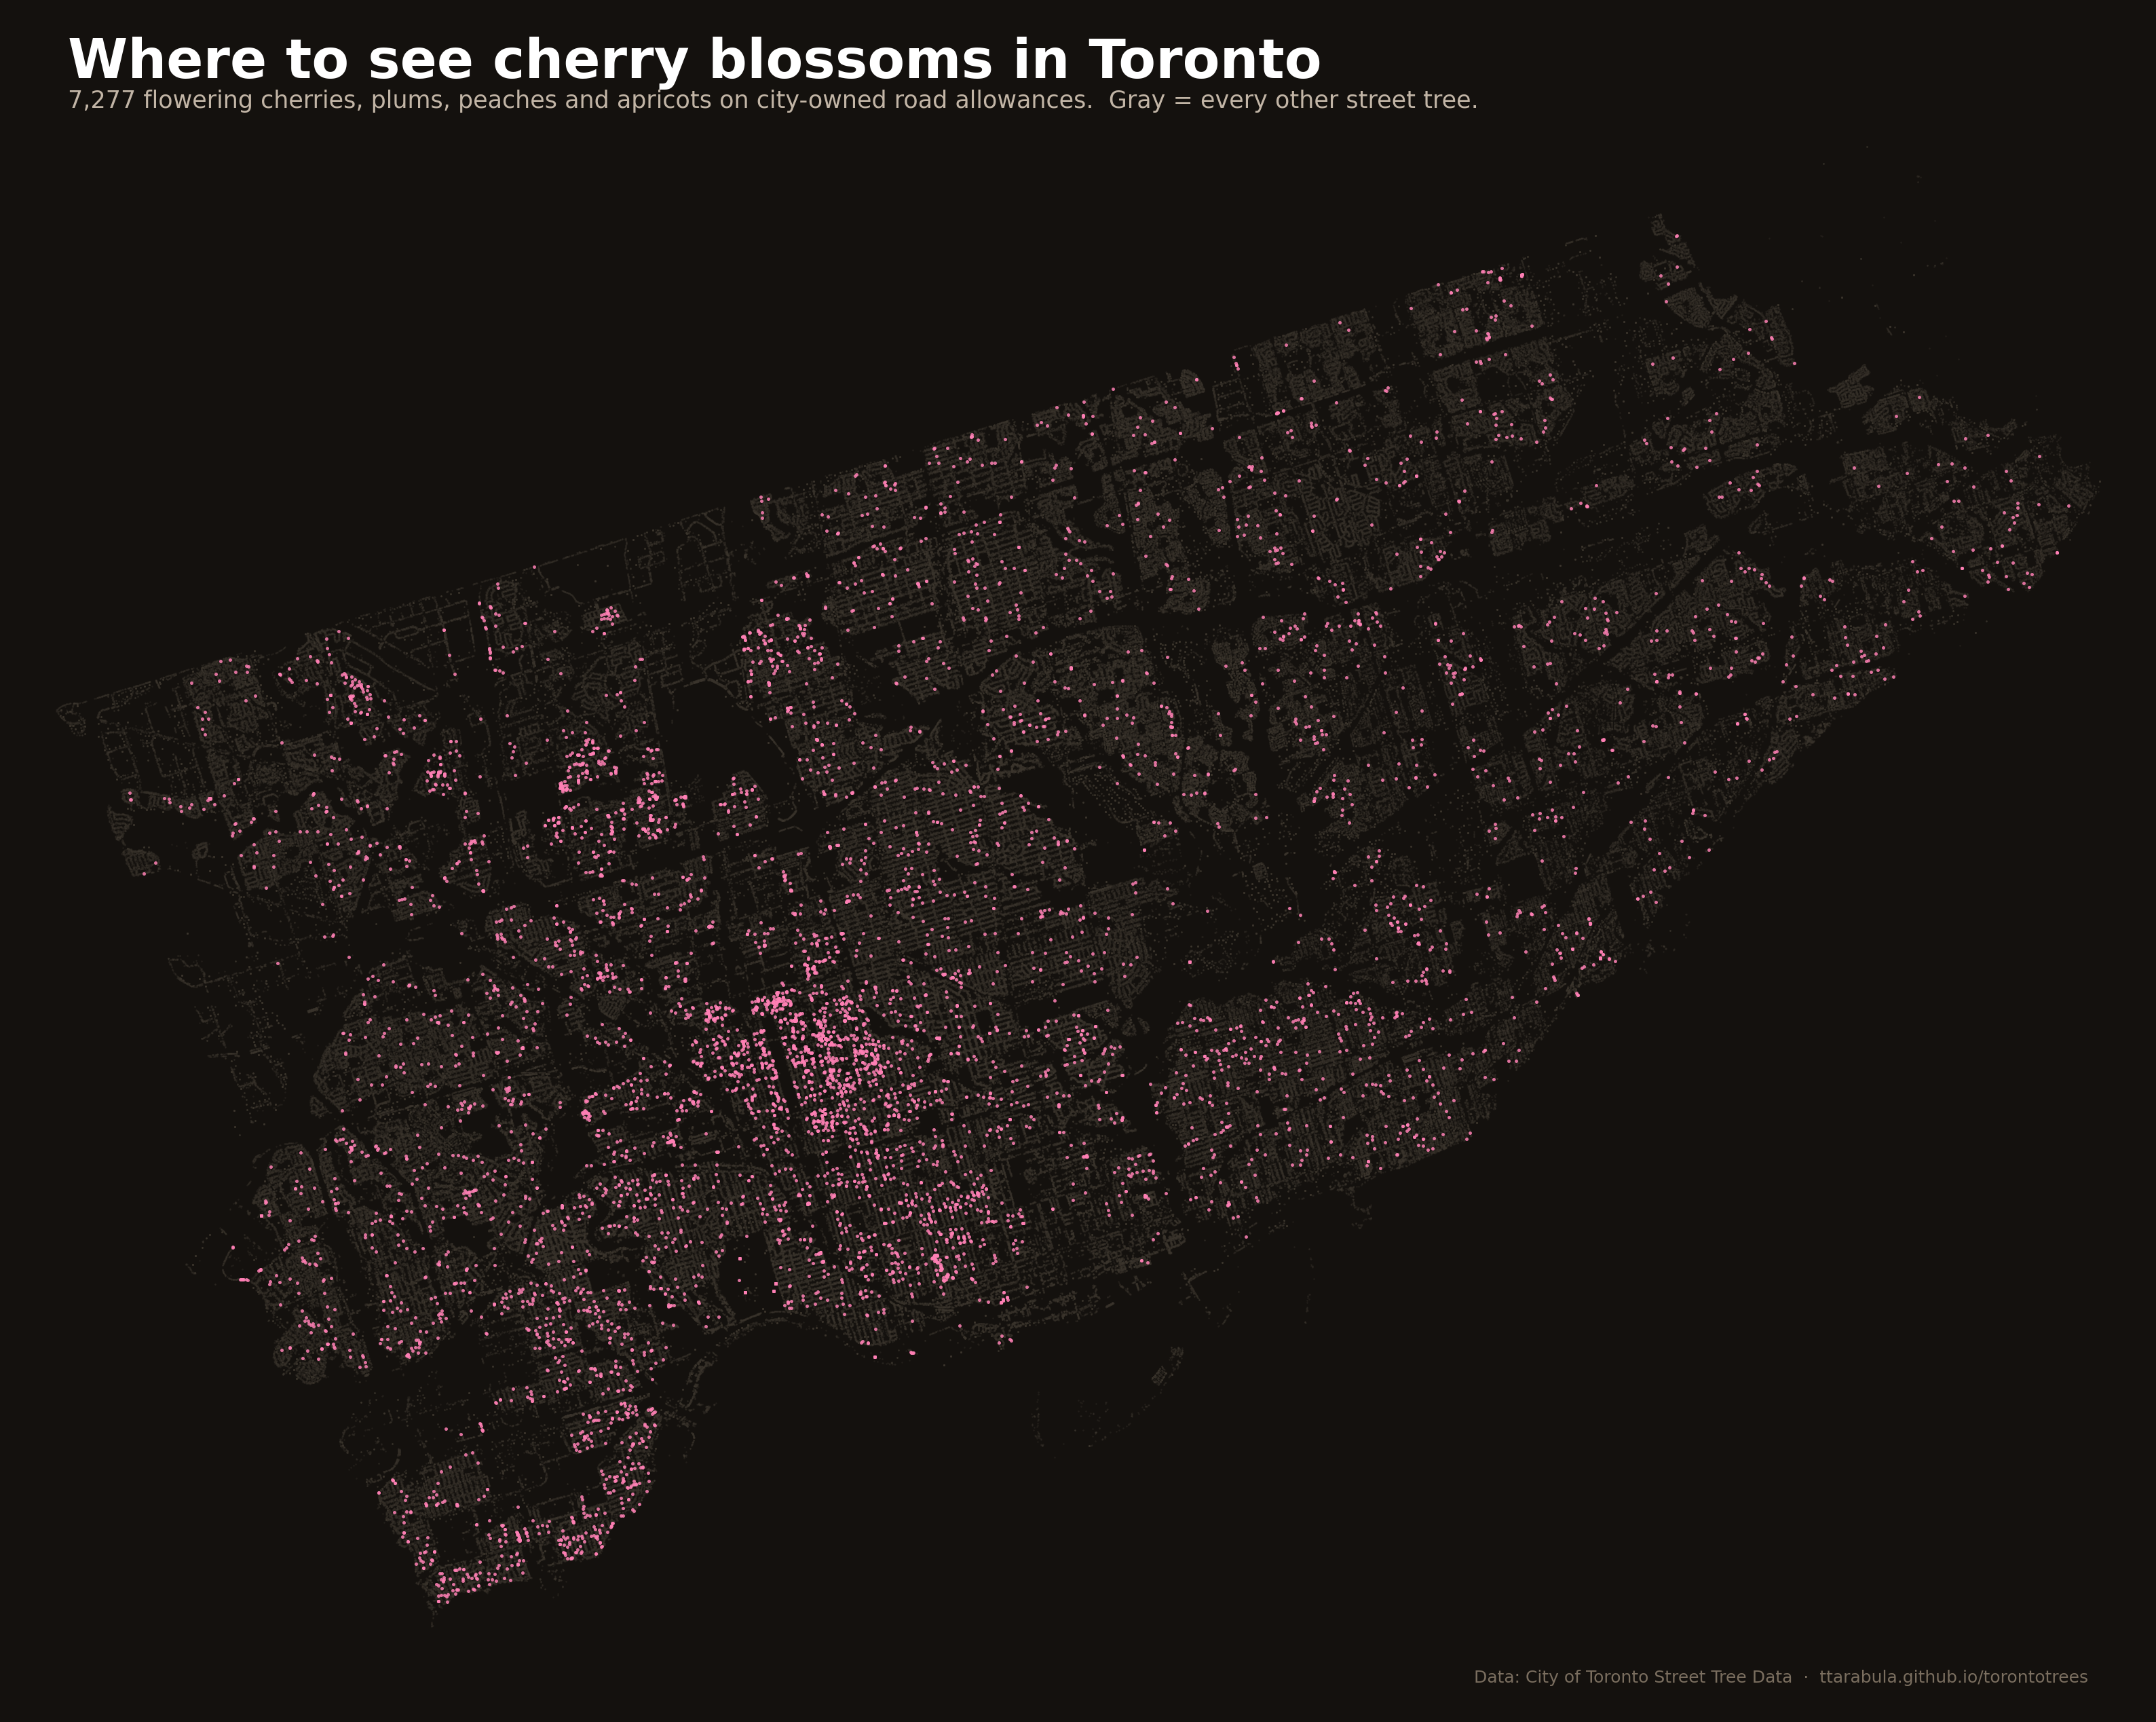
Oakwood Village has 9× more flowering cherry trees than High Park. A spring-pilgrimage guide, with maps and a bloom calendar.
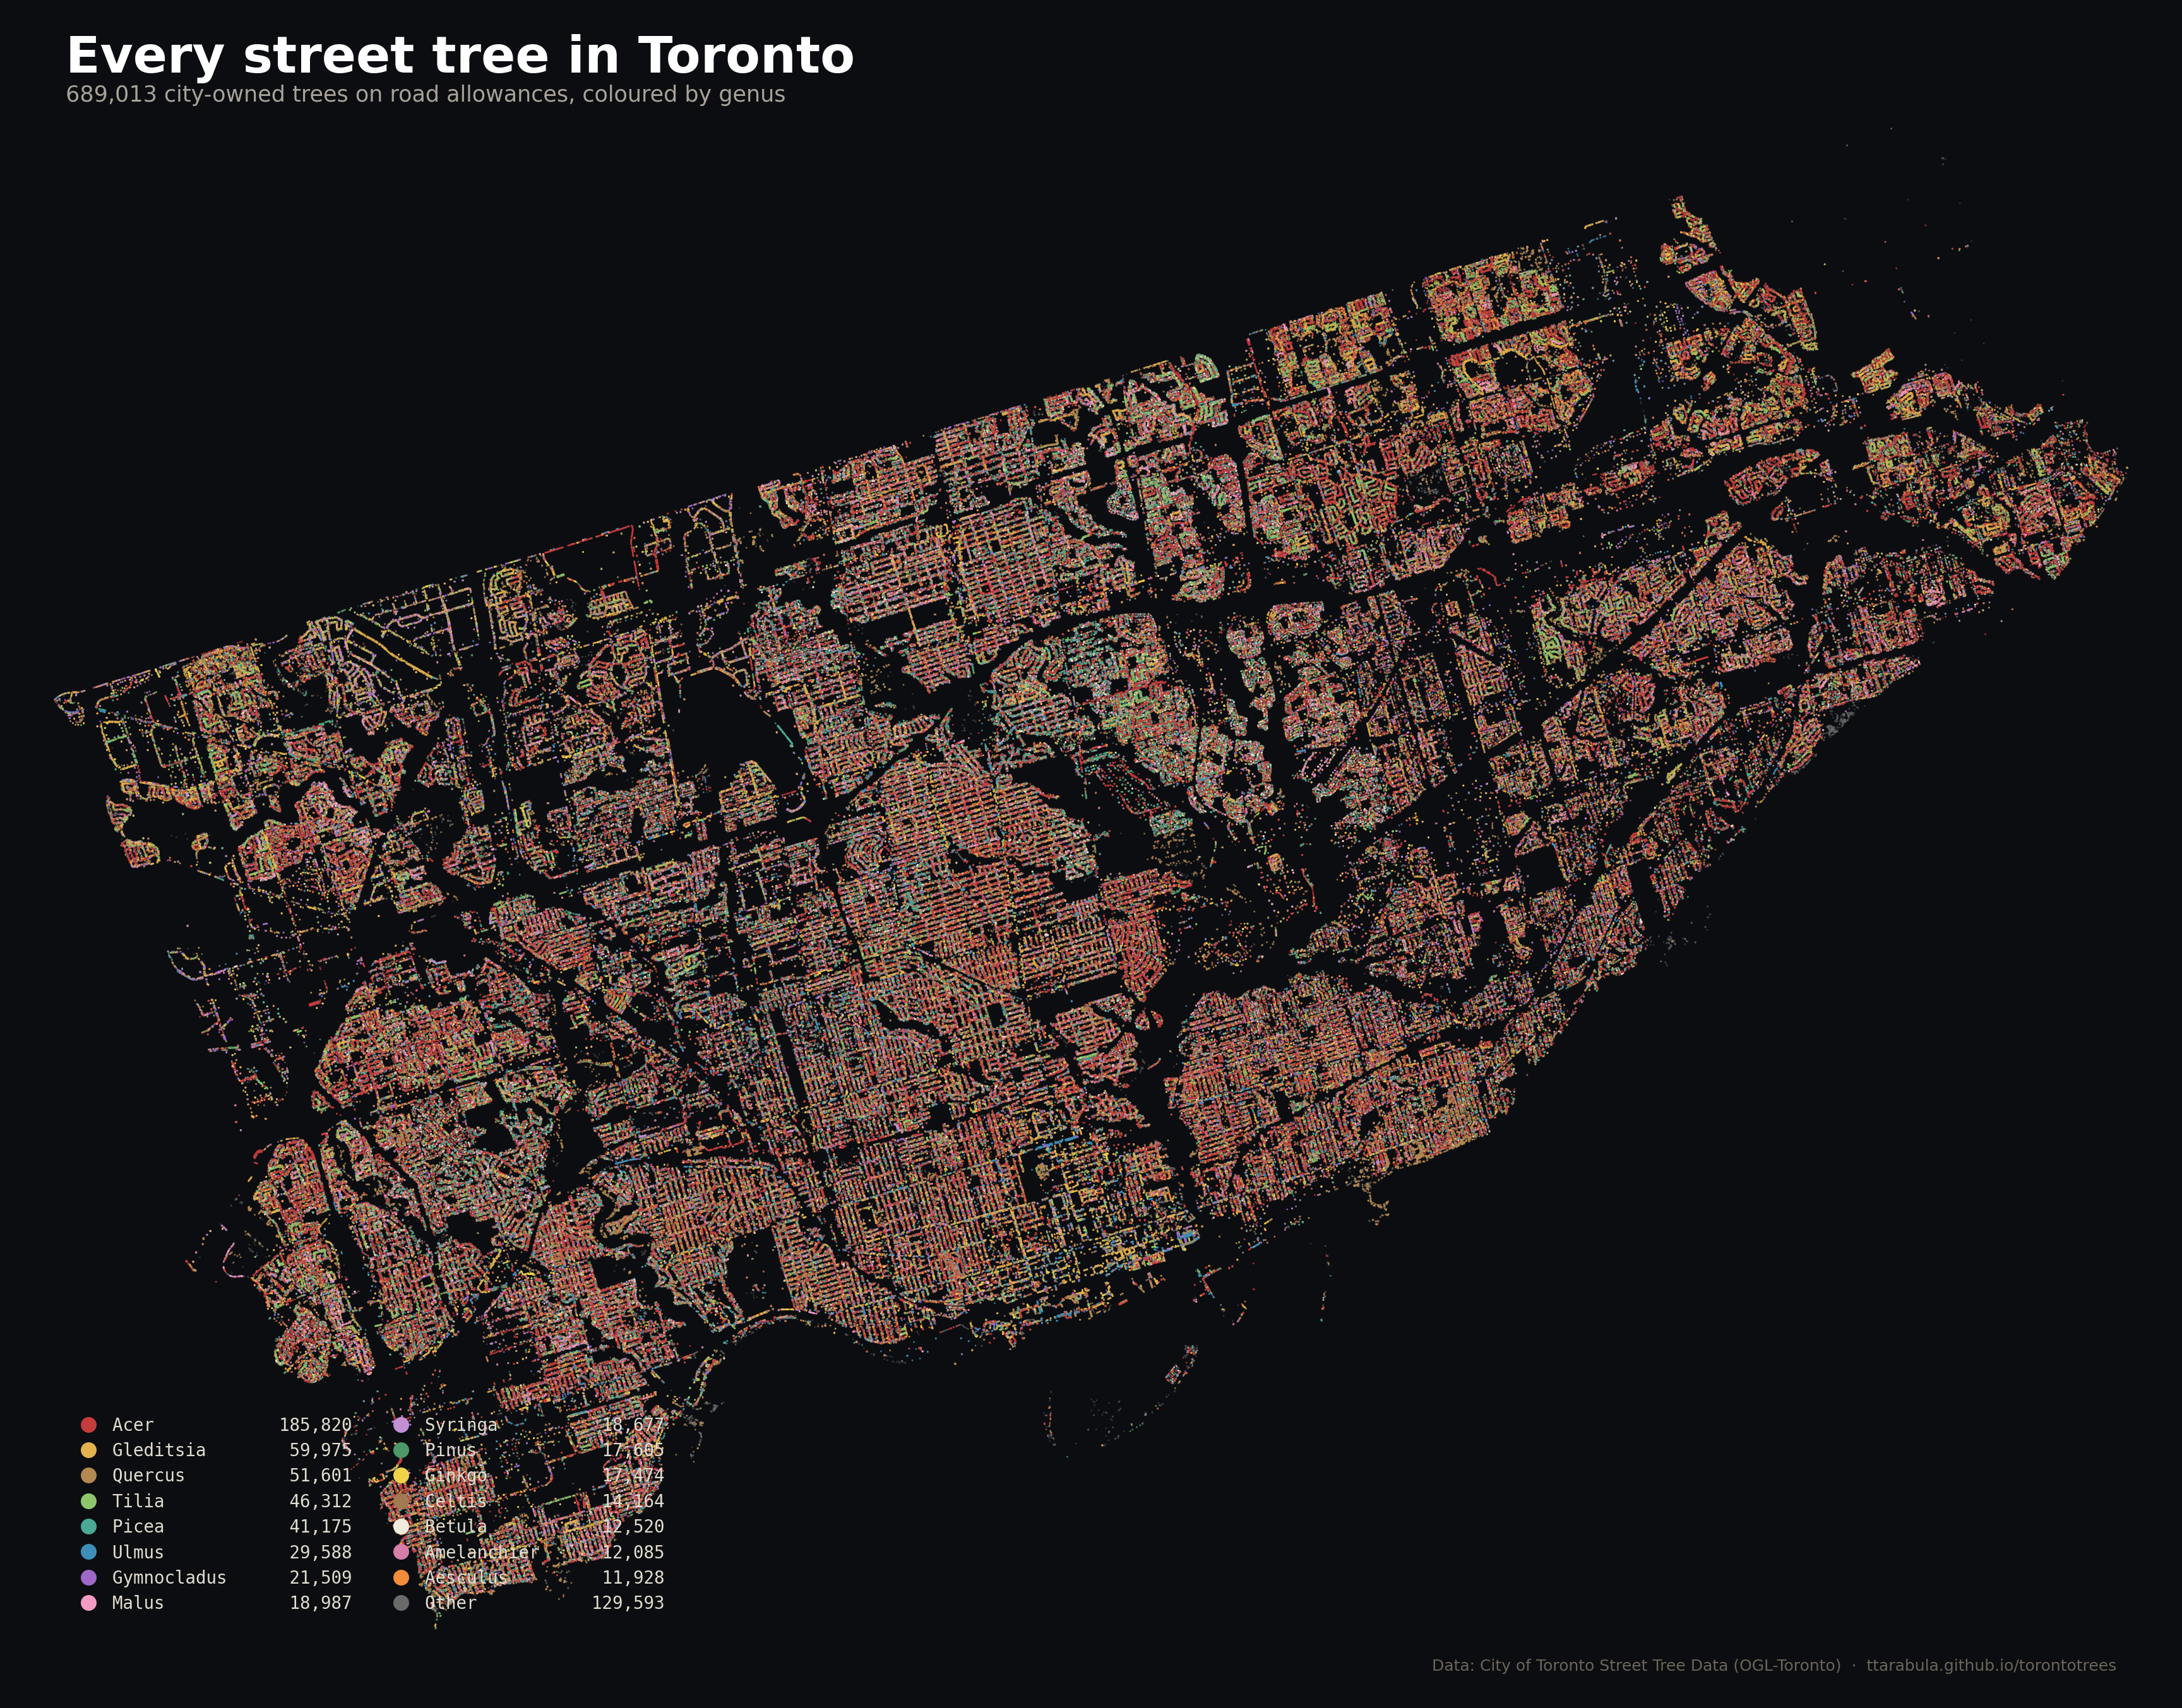
A pointillist portrait of the city, coloured by genus. The street grid, ravines, and one invasive species you can see from space.
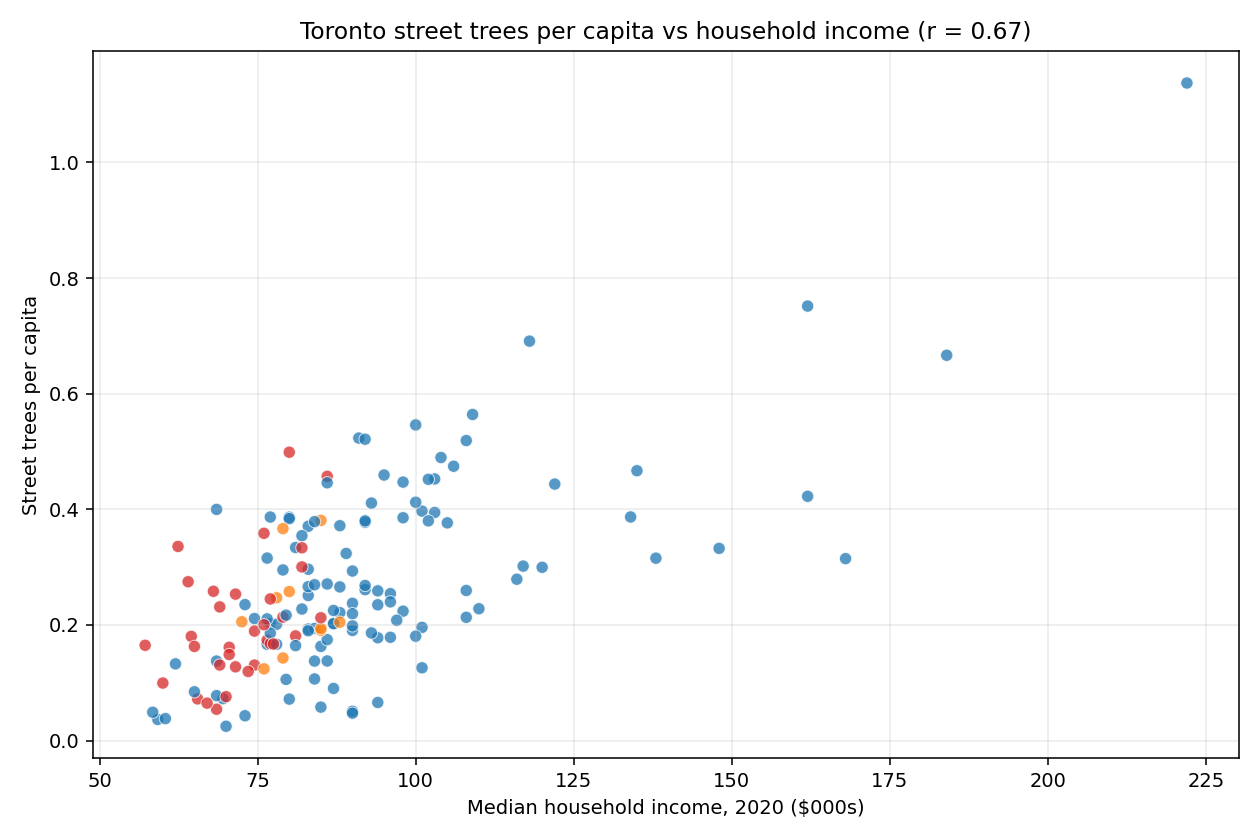
Four findings from the data: why per-capita is the right equity metric, a 23× canopy gap between rich and poor neighbourhoods, and a species retirement story 70,000 trees deep.