Neighbourhood · #024
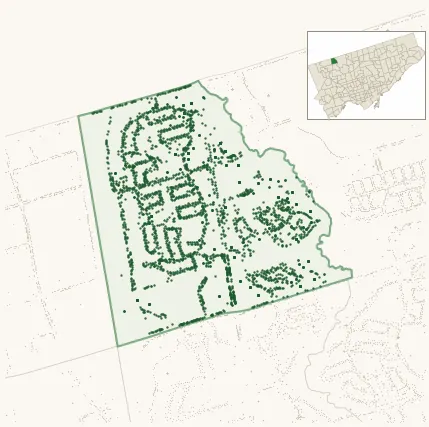
Black Creek
Neighbourhood Improvement Area 3,444 street trees · 0.88 km² · pop. 21,145
What the numbers say
Black Creek is middle-of-the-pack for street trees (111th of 158), with 3,444 city-owned street trees across 0.88 km² — 3,932 per km².
Tree canopy covers 14.5% of the neighbourhood (134th of 158) — down 5.2 points since 2008. (This includes all trees — street, park, and private — from the 2018 land-cover raster.)
Across 138 distinct species (Shannon diversity 3.88, 128th of 158), the most common is gymnocladus dioicus at 7.2% of the trees.
Most common species here
| Species | Trees | Share |
|---|---|---|
| Kentucky Coffeetree gymnocladus dioicus | 249 | 7.2% |
| Honey Locust gleditsia triacanthos | 238 | 6.9% |
| Norway Maple acer platanoides | 218 | 6.3% |
| Honey Locust Skyline gleditsia triacanthos f. inermis 'skyline' | 212 | 6.2% |
| Ginkgo ginkgo biloba | 188 | 5.5% |
The biggest tree on record
A Golden Weeping Willow (salix x sepulcralis 'chrysocoma') at 1 FLETCHERDON CRES — 116 cm DBH, the largest of the 3,444 street trees here. · Street View
Explore
Tree counts and species from the City of Toronto Street Tree dataset (city-owned trees in the road allowance only — not parks or private property). Canopy % and heat proxy derive from the 2018 land-cover raster. Population is from the 2021 census, joined by the 158-neighbourhood model.