Neighbourhood · #071
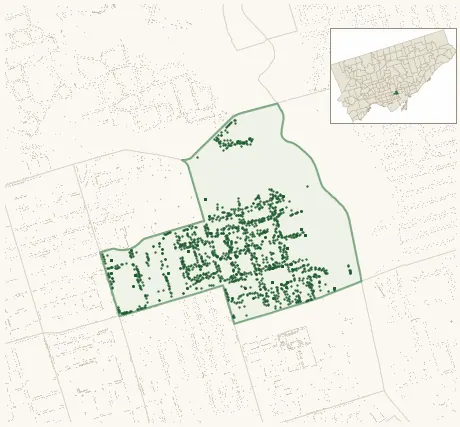
Cabbagetown-South St.James Town
1,836 street trees · 0.36 km² · pop. 11,020
What the numbers say
Cabbagetown-South St.James Town is middle-of-the-pack for street trees (79th of 158), with 1,836 city-owned street trees across 0.36 km² — 5,041 per km².
Tree canopy covers 45.3% of the neighbourhood (7th of 158) — down 2.4 points since 2008. (This includes all trees — street, park, and private — from the 2018 land-cover raster.) Heat-risk proxy ranks it 11th-coolest in the city.
Across 144 distinct species (Shannon diversity 3.94, 118th of 158), the most common is acer platanoides at 13.3% of the trees.
Most common species here
| Species | Trees | Share |
|---|---|---|
| Norway Maple acer platanoides | 244 | 13.3% |
| Honey Locust gleditsia triacanthos | 157 | 8.6% |
| Red Oak quercus rubra | 111 | 6.0% |
| Silver Maple acer saccharinum | 103 | 5.6% |
| Linden tilia | 92 | 5.0% |
The biggest tree on record
A Red Oak (quercus rubra) at 635 PARLIAMENT ST — 133 cm DBH, the largest of the 1,836 street trees here. · Street View
Explore
Tree counts and species from the City of Toronto Street Tree dataset (city-owned trees in the road allowance only — not parks or private property). Canopy % and heat proxy derive from the 2018 land-cover raster. Population is from the 2021 census, joined by the 158-neighbourhood model.