Neighbourhood · #033
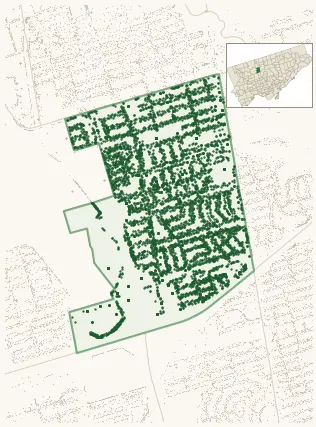
Clanton Park
6,533 street trees · 1.06 km² · pop. 17,620
What the numbers say
Clanton Park is above-average for tree density (45th of 158), with 6,533 city-owned street trees across 1.06 km² — 6,142 per km².
Tree canopy covers 18.4% of the neighbourhood (116th of 158) — essentially unchanged since 2008. (This includes all trees — street, park, and private — from the 2018 land-cover raster.)
Across 180 distinct species (Shannon diversity 4.20, 42nd of 158), the most common is acer platanoides at 7.1% of the trees.
Most common species here
| Species | Trees | Share |
|---|---|---|
| Norway Maple acer platanoides | 464 | 7.1% |
| Colorado Blue Spruce picea pungens | 381 | 5.8% |
| Honey Locust Skyline gleditsia triacanthos f. inermis 'skyline' | 272 | 4.2% |
| Honey Locust Shademaster gleditsia triacanthos f. inermis 'shademaster' | 260 | 4.0% |
| Silver Maple acer saccharinum | 205 | 3.1% |
The biggest tree on record
A Silver Maple (acer saccharinum) at 147 YORK DOWNS DR — 200 cm DBH, the largest of the 6,533 street trees here. · Street View
Explore
Tree counts and species from the City of Toronto Street Tree dataset (city-owned trees in the road allowance only — not parks or private property). Canopy % and heat proxy derive from the 2018 land-cover raster. Population is from the 2021 census, joined by the 158-neighbourhood model.