Neighbourhood · #138
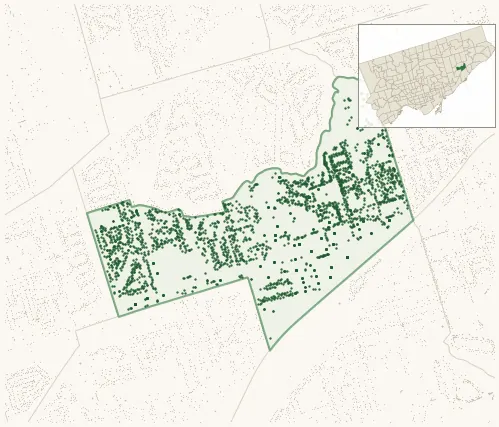
Eglinton East
Neighbourhood Improvement Area 2,687 street trees · 0.84 km² · pop. 22,535
What the numbers say
Eglinton East is middle-of-the-pack for street trees (128th of 158), with 2,687 city-owned street trees across 0.84 km² — 3,206 per km².
Tree canopy covers 22.4% of the neighbourhood (92nd of 158) — up 3.5 points since 2008. (This includes all trees — street, park, and private — from the 2018 land-cover raster.)
Across 130 distinct species (Shannon diversity 3.93, 121st of 158), the most common is tilia cordata at 9.4% of the trees.
Most common species here
| Species | Trees | Share |
|---|---|---|
| Littleleaf Linden tilia cordata | 252 | 9.4% |
| Norway Maple acer platanoides | 163 | 6.1% |
| Honey Locust Shademaster gleditsia triacanthos f. inermis 'shademaster' | 158 | 5.9% |
| Honey Locust Skyline gleditsia triacanthos f. inermis 'skyline' | 141 | 5.2% |
| Japanese Lilac syringa reticulata | 113 | 4.2% |
The biggest tree on record
A Silver Maple (acer saccharinum) at 49 CEDAR BRAE BLVD — 148 cm DBH, the largest of the 2,687 street trees here. · Street View
Explore
Tree counts and species from the City of Toronto Street Tree dataset (city-owned trees in the road allowance only — not parks or private property). Canopy % and heat proxy derive from the 2018 land-cover raster. Population is from the 2021 census, joined by the 158-neighbourhood model.