Neighbourhood · #163
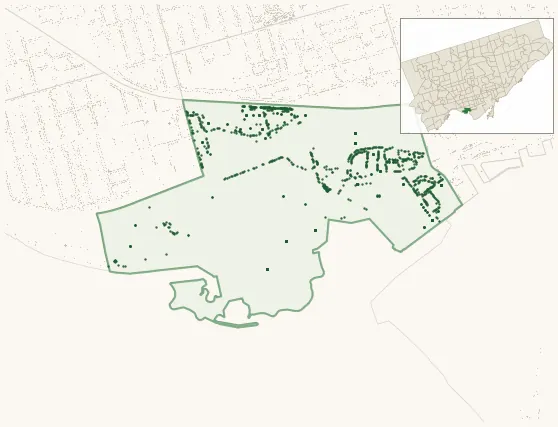
Fort York-Liberty Village
1,313 street trees · 0.60 km² · pop. 19,915
What the numbers say
Fort York-Liberty Village is among the least-forested in the city (153rd of 158), with 1,313 city-owned street trees across 0.60 km² — 2,195 per km².
Tree canopy covers 11.7% of the neighbourhood (144th of 158) — essentially unchanged since 2008. (This includes all trees — street, park, and private — from the 2018 land-cover raster.) Heat-risk proxy ranks it 16th-hottest in the city.
Across 86 distinct species (Shannon diversity 3.73, 145th of 158), the most common is quercus rubra at 11.7% of the trees.
Most common species here
| Species | Trees | Share |
|---|---|---|
| Red Oak quercus rubra | 153 | 11.7% |
| Kentucky Coffeetree gymnocladus dioicus | 83 | 6.3% |
| Honey Locust gleditsia triacanthos | 71 | 5.4% |
| English Pyramidal Oak quercus robur 'fastigiata' | 69 | 5.3% |
| Hackberry celtis occidentalis | 68 | 5.2% |
The biggest tree on record
A Wych Elm (ulmus glabra) at 14 SASKATCHEWAN RD — 125 cm DBH, the largest of the 1,313 street trees here. · Street View
Explore
Tree counts and species from the City of Toronto Street Tree dataset (city-owned trees in the road allowance only — not parks or private property). Canopy % and heat proxy derive from the 2018 land-cover raster. Population is from the 2021 census, joined by the 158-neighbourhood model.