Neighbourhood · #130
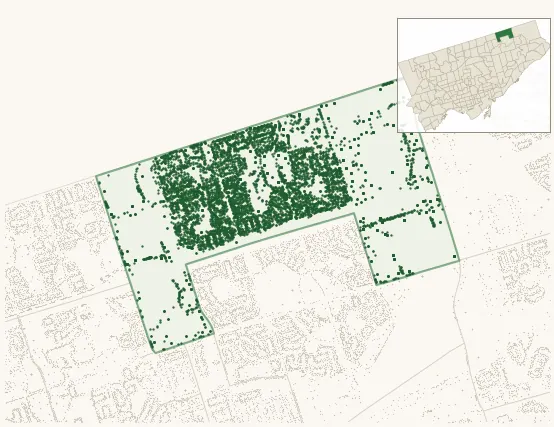
Milliken
7,976 street trees · 2.46 km² · pop. 23,980
What the numbers say
Milliken is middle-of-the-pack for street trees (127th of 158), with 7,976 city-owned street trees across 2.46 km² — 3,240 per km².
Tree canopy covers 9.4% of the neighbourhood (151st of 158) — essentially unchanged since 2008. (This includes all trees — street, park, and private — from the 2018 land-cover raster.) Heat-risk proxy ranks it 19th-hottest in the city.
Across 153 distinct species (Shannon diversity 3.94, 120th of 158), the most common is acer platanoides at 11.1% of the trees.
Most common species here
| Species | Trees | Share |
|---|---|---|
| Norway Maple acer platanoides | 886 | 11.1% |
| Littleleaf Linden tilia cordata | 653 | 8.2% |
| Honey Locust Skyline gleditsia triacanthos f. inermis 'skyline' | 374 | 4.7% |
| Honey Locust Shademaster gleditsia triacanthos f. inermis 'shademaster' | 341 | 4.3% |
| Hackberry celtis occidentalis | 340 | 4.3% |
The biggest tree on record
A Turkish Hazel (corylus colurna) at 70 NASHDENE RD — 156 cm DBH, the largest of the 7,976 street trees here. · Street View
Explore
Tree counts and species from the City of Toronto Street Tree dataset (city-owned trees in the road allowance only — not parks or private property). Canopy % and heat proxy derive from the 2018 land-cover raster. Population is from the 2021 census, joined by the 158-neighbourhood model.