Neighbourhood · #073
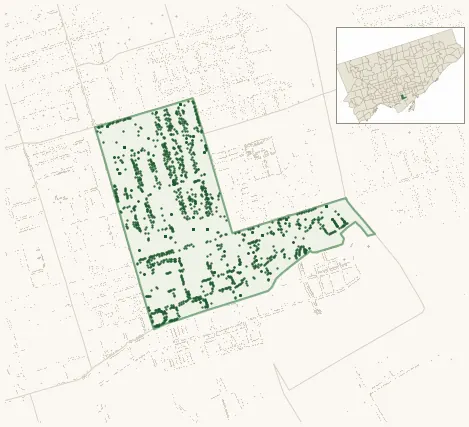
Moss Park
1,814 street trees · 0.36 km² · pop. 21,490
What the numbers say
Moss Park is middle-of-the-pack for street trees (78th of 158), with 1,814 city-owned street trees across 0.36 km² — 5,057 per km².
Tree canopy covers 19.2% of the neighbourhood (112th of 158) — essentially unchanged since 2008. (This includes all trees — street, park, and private — from the 2018 land-cover raster.)
Across 130 distinct species (Shannon diversity 3.65, 147th of 158), the most common is gleditsia triacanthos at 20.0% of the trees.
Most common species here
| Species | Trees | Share |
|---|---|---|
| Honey Locust gleditsia triacanthos | 362 | 20.0% |
| Norway Maple acer platanoides | 169 | 9.3% |
| Elm ulmus | 115 | 6.3% |
| Linden tilia | 64 | 3.5% |
| Kentucky Coffeetree gymnocladus dioicus | 64 | 3.5% |
The biggest tree on record
A Wych Elm (ulmus glabra) at 121 CARLTON ST — 170 cm DBH, the largest of the 1,814 street trees here. · Street View
Explore
Tree counts and species from the City of Toronto Street Tree dataset (city-owned trees in the road allowance only — not parks or private property). Canopy % and heat proxy derive from the 2018 land-cover raster. Population is from the 2021 census, joined by the 158-neighbourhood model.