Neighbourhood · #173
North Toronto
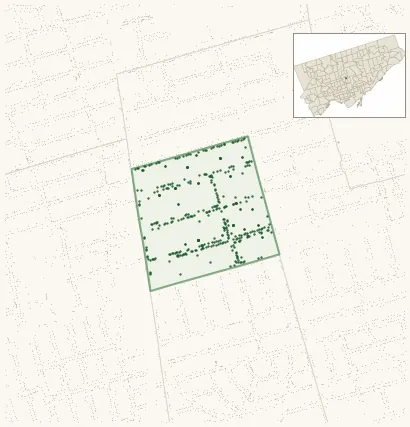
394 street trees · 0.10 km² · pop. 15,885
What the numbers say
North Toronto is middle-of-the-pack for street trees (112th of 158), with 394 city-owned street trees across 0.10 km² — 3,823 per km².
Tree canopy covers 11.1% of the neighbourhood (148th of 158) — essentially unchanged since 2008. (This includes all trees — street, park, and private — from the 2018 land-cover raster.) Heat-risk proxy ranks it 6th-hottest in the city.
Across 82 distinct species (Shannon diversity 3.65, 148th of 158), the most common is acer platanoides at 12.7% of the trees.
Most common species here
| Species | Trees | Share |
|---|---|---|
| Norway Maple acer platanoides | 50 | 12.7% |
| Honey Locust gleditsia triacanthos | 47 | 11.9% |
| Red Oak quercus rubra | 24 | 6.1% |
| Austrian Pine pinus nigra | 21 | 5.3% |
| Red Maple acer rubrum | 19 | 4.8% |
The biggest tree on record
A Norway Maple (acer platanoides) at 140 ERSKINE AVE — 83 cm DBH, the largest of the 394 street trees here. · Street View
Explore
Tree counts and species from the City of Toronto Street Tree dataset (city-owned trees in the road allowance only — not parks or private property). Canopy % and heat proxy derive from the 2018 land-cover raster. Population is from the 2021 census, joined by the 158-neighbourhood model.