Neighbourhood · #072
Regent Park
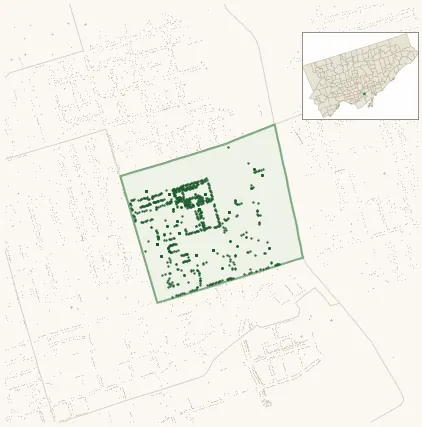
Neighbourhood Improvement Area 920 street trees · 0.17 km² · pop. 12,750
What the numbers say
Regent Park is middle-of-the-pack for street trees (61st of 158), with 920 city-owned street trees across 0.17 km² — 5,505 per km².
Tree canopy covers 13.9% of the neighbourhood (138th of 158) — essentially unchanged since 2008. (This includes all trees — street, park, and private — from the 2018 land-cover raster.) Heat-risk proxy ranks it 20th-hottest in the city.
Across 85 distinct species (Shannon diversity 3.74, 144th of 158), the most common is quercus rubra at 8.6% of the trees.
Most common species here
| Species | Trees | Share |
|---|---|---|
| Red Oak quercus rubra | 79 | 8.6% |
| London Planetree platanus x acerifolia | 63 | 6.8% |
| London Bloodgood Planetree platanus x acerifolia 'bloodgood' | 60 | 6.5% |
| Honey Locust gleditsia triacanthos | 52 | 5.7% |
| Swamp White Oak quercus bicolor | 52 | 5.7% |
The biggest tree on record
A Ruby Red Horsechestnut (aesculus x carnea 'briotii') at 46 REGENT ST TORONTO — 105 cm DBH, the largest of the 920 street trees here. · Street View
Explore
Tree counts and species from the City of Toronto Street Tree dataset (city-owned trees in the road allowance only — not parks or private property). Canopy % and heat proxy derive from the 2018 land-cover raster. Population is from the 2021 census, joined by the 158-neighbourhood model.