Neighbourhood · #070
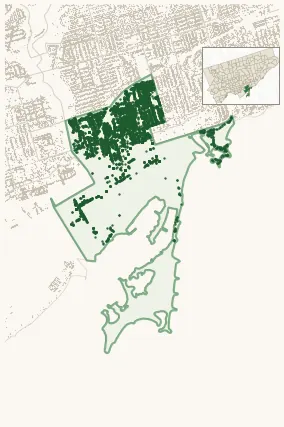
South Riverdale
5,021 street trees · 2.84 km² · pop. 27,815
What the numbers say
South Riverdale is among the least-forested in the city (154th of 158), with 5,021 city-owned street trees across 2.84 km² — 1,768 per km².
Tree canopy covers 15.9% of the neighbourhood (128th of 158) — up 1.3 points since 2008. (This includes all trees — street, park, and private — from the 2018 land-cover raster.)
Across 176 distinct species (Shannon diversity 4.14, 65th of 158), the most common is acer platanoides at 9.5% of the trees.
Most common species here
| Species | Trees | Share |
|---|---|---|
| Norway Maple acer platanoides | 474 | 9.4% |
| Silver Maple acer saccharinum | 290 | 5.8% |
| Honey Locust gleditsia triacanthos | 277 | 5.5% |
| Red Oak quercus rubra | 245 | 4.9% |
| Green Ash fraxinus pennsylvanica | 209 | 4.2% |
The biggest tree on record
A Silver Maple (acer saccharinum) at 97 MORSE ST — 174 cm DBH, the largest of the 5,021 street trees here. · Street View
Explore
Tree counts and species from the City of Toronto Street Tree dataset (city-owned trees in the road allowance only — not parks or private property). Canopy % and heat proxy derive from the 2018 land-cover raster. Population is from the 2021 census, joined by the 158-neighbourhood model.