Neighbourhood · #063
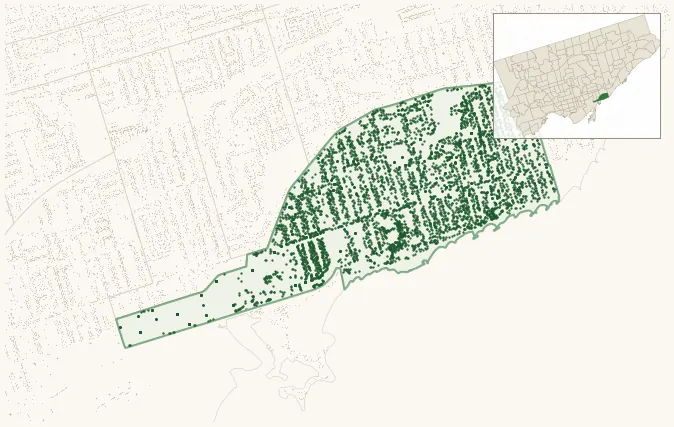
The Beaches
6,003 street trees · 0.93 km² · pop. 21,510
What the numbers say
The Beaches is above-average for tree density (34th of 158), with 6,003 city-owned street trees across 0.93 km² — 6,459 per km².
Tree canopy covers 37.8% of the neighbourhood (25th of 158) — down 1.4 points since 2008. (This includes all trees — street, park, and private — from the 2018 land-cover raster.)
Across 181 distinct species (Shannon diversity 4.01, 102nd of 158), the most common is quercus rubra at 15.7% of the trees.
Most common species here
| Species | Trees | Share |
|---|---|---|
| Red Oak quercus rubra | 944 | 15.7% |
| Norway Maple acer platanoides | 405 | 6.7% |
| Green Ash fraxinus pennsylvanica | 243 | 4.0% |
| White Oak quercus alba | 228 | 3.8% |
| Linden tilia | 185 | 3.1% |
The biggest tree on record
A Black Oak (quercus velutina) at 172 SCARBOROUGH RD — 178 cm DBH, the largest of the 6,003 street trees here. · Street View
Explore
Tree counts and species from the City of Toronto Street Tree dataset (city-owned trees in the road allowance only — not parks or private property). Canopy % and heat proxy derive from the 2018 land-cover raster. Population is from the 2021 census, joined by the 158-neighbourhood model.