Neighbourhood · #162
West Queen West
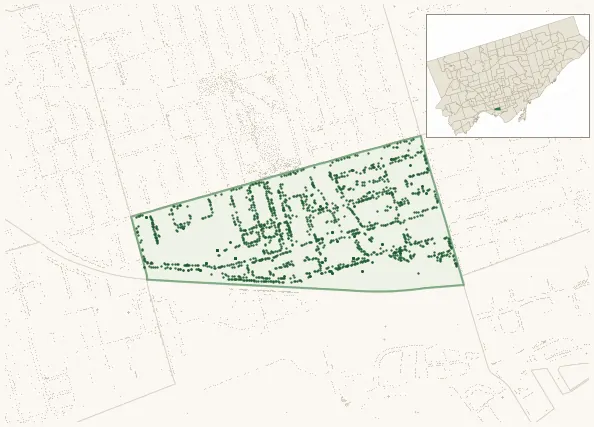
1,658 street trees · 0.23 km² · pop. 13,170
What the numbers say
West Queen West is above-average for tree density (24th of 158), with 1,658 city-owned street trees across 0.23 km² — 7,190 per km².
Tree canopy covers 14.3% of the neighbourhood (136th of 158) — essentially unchanged since 2008. (This includes all trees — street, park, and private — from the 2018 land-cover raster.) Heat-risk proxy ranks it 14th-hottest in the city.
Across 132 distinct species (Shannon diversity 3.98, 109th of 158), the most common is gleditsia triacanthos at 8.6% of the trees.
Most common species here
| Species | Trees | Share |
|---|---|---|
| Honey Locust gleditsia triacanthos | 142 | 8.6% |
| Norway Maple acer platanoides | 123 | 7.4% |
| Red Oak quercus rubra | 82 | 4.9% |
| Littleleaf Linden tilia cordata | 78 | 4.7% |
| Elm ulmus | 72 | 4.3% |
The biggest tree on record
A Silver Maple (acer saccharinum) at 86 CRAWFORD ST — 110 cm DBH, the largest of the 1,658 street trees here. · Street View
Explore
Tree counts and species from the City of Toronto Street Tree dataset (city-owned trees in the road allowance only — not parks or private property). Canopy % and heat proxy derive from the 2018 land-cover raster. Population is from the 2021 census, joined by the 158-neighbourhood model.