Neighbourhood · #064
Woodbine Corridor
2,541 street trees · 0.41 km² · pop. 12,205
What the numbers say
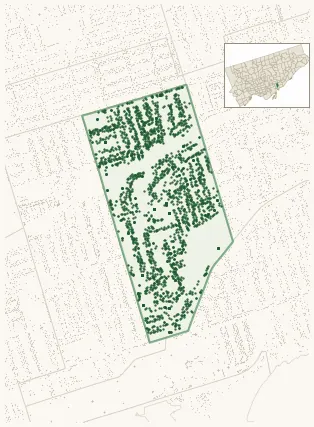
Woodbine Corridor is above-average for tree density (44th of 158), with 2,541 city-owned street trees across 0.41 km² — 6,169 per km².
Tree canopy covers 38.1% of the neighbourhood (24th of 158) — essentially unchanged since 2008. (This includes all trees — street, park, and private — from the 2018 land-cover raster.)
Across 155 distinct species (Shannon diversity 4.10, 77th of 158), the most common is acer platanoides at 13.5% of the trees.
Most common species here
| Species | Trees | Share |
|---|---|---|
| Norway Maple acer platanoides | 343 | 13.5% |
| Red Oak quercus rubra | 137 | 5.4% |
| Linden tilia | 104 | 4.1% |
| Honey Locust gleditsia triacanthos | 85 | 3.3% |
| Serviceberry amelanchier canadensis | 77 | 3.0% |
The biggest tree on record
A Norway Emerald Queen Maple (acer platanoides 'emerald queen') at 36 WEST LYNN AVE — 200 cm DBH, the largest of the 2,541 street trees here. · Street View
Explore
Tree counts and species from the City of Toronto Street Tree dataset (city-owned trees in the road allowance only — not parks or private property). Canopy % and heat proxy derive from the 2018 land-cover raster. Population is from the 2021 census, joined by the 158-neighbourhood model.