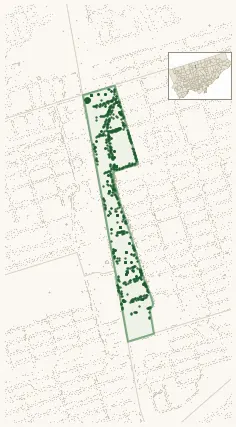
Neighbourhood · #151
Yonge-Doris
866 street trees · 0.12 km² · pop. 20,160
What the numbers say
Yonge-Doris is above-average for tree density (25th of 158), with 866 city-owned street trees across 0.12 km² — 7,165 per km².
Tree canopy covers 12.4% of the neighbourhood (142nd of 158) — down 1.1 points since 2008. (This includes all trees — street, park, and private — from the 2018 land-cover raster.) Heat-risk proxy ranks it 10th-hottest in the city.
Across 79 distinct species (Shannon diversity 3.55, 151st of 158), the most common is gleditsia triacanthos at 11.7% of the trees.
Most common species here
| Species | Trees | Share |
|---|---|---|
| Honey Locust gleditsia triacanthos | 101 | 11.7% |
| Red Oak quercus rubra | 76 | 8.8% |
| Japanese Lilac syringa reticulata | 65 | 7.5% |
| Ginkgo ginkgo biloba | 49 | 5.7% |
| Littleleaf Linden tilia cordata | 48 | 5.5% |
The biggest tree on record
A Red Oak (quercus rubra) at 76 CORAL GABLE DR — 168 cm DBH, the largest of the 866 street trees here. · Street View
Explore
Tree counts and species from the City of Toronto Street Tree dataset (city-owned trees in the road allowance only — not parks or private property). Canopy % and heat proxy derive from the 2018 land-cover raster. Population is from the 2021 census, joined by the 158-neighbourhood model.