Neighbourhood · #078
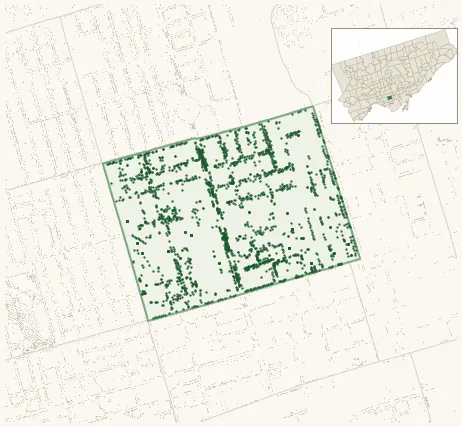
Kensington-Chinatown
2,405 street trees · 0.39 km² · pop. 18,120
What the numbers say
Kensington-Chinatown is above-average for tree density (46th of 158), with 2,405 city-owned street trees across 0.39 km² — 6,120 per km².
Tree canopy covers 15.3% of the neighbourhood (130th of 158) — essentially unchanged since 2008. (This includes all trees — street, park, and private — from the 2018 land-cover raster.) Heat-risk proxy ranks it 17th-hottest in the city.
Across 129 distinct species (Shannon diversity 3.68, 146th of 158), the most common is gleditsia triacanthos at 20.2% of the trees.
Most common species here
| Species | Trees | Share |
|---|---|---|
| Honey Locust gleditsia triacanthos | 485 | 20.2% |
| Norway Maple acer platanoides | 176 | 7.3% |
| Elm ulmus | 107 | 4.4% |
| Horsechestnut aesculus hippocastanum | 104 | 4.3% |
| Silver Maple acer saccharinum | 93 | 3.9% |
The biggest tree on record
A Rock Elm (ulmus thomasii) at 275 BATHURST ST — 165 cm DBH, the largest of the 2,405 street trees here. · Street View
Explore
Tree counts and species from the City of Toronto Street Tree dataset (city-owned trees in the road allowance only — not parks or private property). Canopy % and heat proxy derive from the 2018 land-cover raster. Population is from the 2021 census, joined by the 158-neighbourhood model.