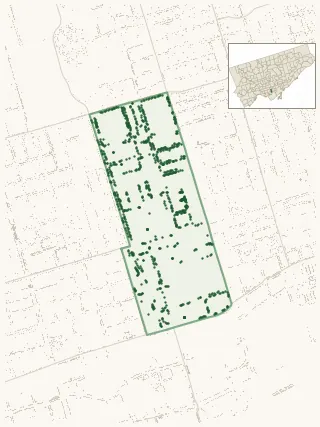
Neighbourhood · #170
Yonge-Bay Corridor
983 street trees · 0.29 km² · pop. 12,645
What the numbers say
Yonge-Bay Corridor is middle-of-the-pack for street trees (122nd of 158), with 983 city-owned street trees across 0.29 km² — 3,427 per km².
Tree canopy covers 4.3% of the neighbourhood (158th of 158) — essentially unchanged since 2008. (This includes all trees — street, park, and private — from the 2018 land-cover raster.) Heat-risk proxy ranks it 1st-hottest in the city.
Across 45 distinct species (Shannon diversity 2.78, 158th of 158), the most common is gleditsia triacanthos at 22.9% of the trees.
Most common species here
| Species | Trees | Share |
|---|---|---|
| Honey Locust gleditsia triacanthos | 225 | 22.9% |
| Elm ulmus | 138 | 14.0% |
| Honey Locust Ruby Lace gleditsia triacanthos f. inermis 'ruby lace' | 91 | 9.3% |
| Kentucky Coffeetree gymnocladus dioicus | 81 | 8.2% |
| Littleleaf Linden tilia cordata | 61 | 6.2% |
The biggest tree on record
A Linden (tilia) at 375 UNIVERSITY AVE — 80 cm DBH, the largest of the 983 street trees here. · Street View
Explore
Tree counts and species from the City of Toronto Street Tree dataset (city-owned trees in the road allowance only — not parks or private property). Canopy % and heat proxy derive from the 2018 land-cover raster. Population is from the 2021 census, joined by the 158-neighbourhood model.