May 2026 · on street form and street trees
Stand at the corner of Warren Road and Kilbarry Road in Forest Hill South. In 200 metres you can count forty-plus street trees — Norway maples lining the east boulevard, a platoon of honey locusts on the west, a stretch of red oaks between them, and, a block up, a 199-centimetre European beech the city has catalogued as a heritage specimen. The street is quiet, two narrow lanes wide. You can hear the leaves moving.
Now stand at the corner of Fort York Boulevard and Lake Shore Boulevard West. You might count three. One is a skinny Kentucky coffeetree strapped to a lamp post. Two are honey locusts in raised planters at the base of a 45-storey tower. The street is four lanes wide in each direction, sealed in concrete from building face to building face, with nowhere for a root to live.
These two corners are about 10 km apart. They are in the same city, governed by the same forestry department, planted by the same crews against the same species lists. The difference between them is not income. It is not wealth. It is not care, or policy, or advocacy, or any of the usual narratives about why some neighbourhoods feel like forests and others feel like parking lots. The difference is simpler, older, and mostly irreversible:
It is whether there is a boulevard.
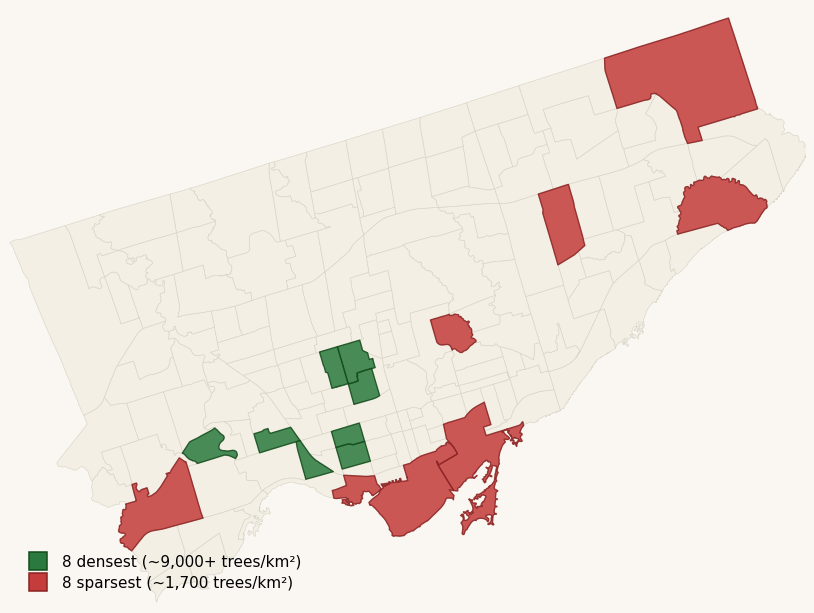
Rank all 158 Toronto neighbourhoods by city-owned street trees per square kilometre. Every one of the eight densest is an old-grid neighbourhood — a pre-1930 survey of narrow residential streets holding Victorian rowhouses, Edwardian duplexes, or narrow-lot detached houses from Toronto's first streetcar-suburb era.
| Neighbourhood | Trees / km² | Era |
|---|---|---|
| Forest Hill South | 9,653 | 1920s |
| Palmerston-Little Italy | 9,505 | 1890s |
| Casa Loma | 9,101 | 1900s |
| Trinity-Bellwoods | 9,101 | 1880s |
| Kingsway South | 8,827 | 1920s |
| High Park North | 8,798 | 1900s |
| Humewood-Cedarvale | 8,581 | 1910s |
| Roncesvalles | 8,428 | 1890s |
Now rank them from the bottom. Every one of the eight sparsest is a post-1960 development: condo-era waterfront fill, tower-in-the-park modernism, or a post-war suburban subdivision with tucked-back houses and wide roads.
| Neighbourhood | Trees / km² | Era |
|---|---|---|
| St Lawrence-East Bayfront-The Islands | 972 | 2010s fill |
| Morningside Heights | 994 | 1980s |
| Thorncliffe Park | 1,643 | 1960s |
| Etobicoke City Centre | 1,752 | 1990s+ |
| South Riverdale | 1,768 | mixed, industrial |
| Fort York-Liberty Village | 2,195 | 2000s+ |
| Dorset Park | 2,227 | 1960s |
| West Hill | 2,238 | 1960s |
The average of the top eight is 9,000 trees per km². The average of the bottom eight is 1,700. A fivefold gap, and almost exactly the gap between a streetcar-era grid and a postwar subdivision.
A "boulevard," in Toronto's forestry vocabulary, is the strip of earth between the sidewalk and the curb. It is the only part of a street the urban forestry department is allowed to plant trees in — everything inside the property line belongs to the landowner, and everything inside the curb belongs to Transportation Services.
That strip is two metres wide on a typical Trinity-Bellwoods street, roughly the width of a parked car. It is wide enough for a honey locust root-ball, a soil volume that'll keep a fifty-year-old canopy alive, and a modest slab of lawn. Multiply that strip by six hundred kilometres of 1890s-surveyed residential street, and you get a forest.
Now consider a modern condo street. Fort York Boulevard is forty-five metres wide. Six lanes of moving cars, parking, turn bays, protected cycle tracks, and sidewalks consume virtually the entire right-of-way. Whatever room is left goes to buried utilities, fire hydrants, driveway ramps, and sight-line triangles. Planting a boulevard tree there is not a policy choice the city makes at its discretion; it is a physical impossibility at the scale of most blocks. The tree goes in a planter, or it doesn't go at all.
It's tempting to frame this as an inequity finding — old money vs. new condos, established vs. transient. It isn't. Forest Hill South is wealthy; Palmerston-Little Italy and Trinity-Bellwoods are mid-income; Roncesvalles is middle-of-the-pack. At the other end, Fort York-Liberty Village has higher household income than the city median; Etobicoke City Centre is roughly average. Some of the most tree-poor postcodes in Toronto are home to young professionals with urban-forestry opinions.
The variable that explains the pattern is the age of the street grid, not the wealth of the people on it. A 2010s-built waterfront neighbourhood full of $1.5M condos will have fewer street trees per km² than a 1890s-built working-class neighbourhood two kilometres away. The boulevard is what the trees see, and the boulevard is a function of when the survey was drawn.
If you want to feel this difference on your feet, the cleanest contrast is inside a two-kilometre walk:
The rowhouse canopy — start at College St and Bathurst St, walk east two blocks, then south down any of the streets between Manning and Euclid. You are inside the Palmerston-Little Italy grid. Every block has a boulevard, every boulevard has a Norway maple or a honey locust, and in summer the canopy closes overhead. The street is 14 m curb-to-property-line. There are three-storey houses on either side.
The condo-era desert — from there, walk south to King St, then west along King until you reach Strachan Ave. Keep going west into Fort York-Liberty Village. The streets are forty-plus metres wide. The buildings are twelve to forty-five storeys. The trees exist, but in planters, on setback strips, around the edges of little public plazas. Nothing overhead.
The neighbourhoods were developed a century apart. The forestry department is doing about the same job in both. It's the streets that are different.
Go deeper:
Canopy equity — the income correlation →